What to act on this week.
Across your accounts. Across your product.
Proactive product analytics for B2B SaaS. Which accounts to call, which product friction to fix — each with the reason and the next step, every Monday.
 Built in Hamburg, Germany. Hosted in Europe.
| 14-day free trial | No credit card required
Built in Hamburg, Germany. Hosted in Europe.
| 14-day free trial | No credit card required The problem
You can ask PostHog AI anything. But you have to know to ask.
Which account's champion went dark this week. Whose AI feature usage stalled. Which starter plan is silently using enterprise workflows. PostHog and Amplitude can answer every one of those questions — if you remember to ask, about the right account, on the right Monday. Most weeks, nobody does. You just need the problems surfaced before you'd think to look.
How it works
Connect your product.
Get the insights.
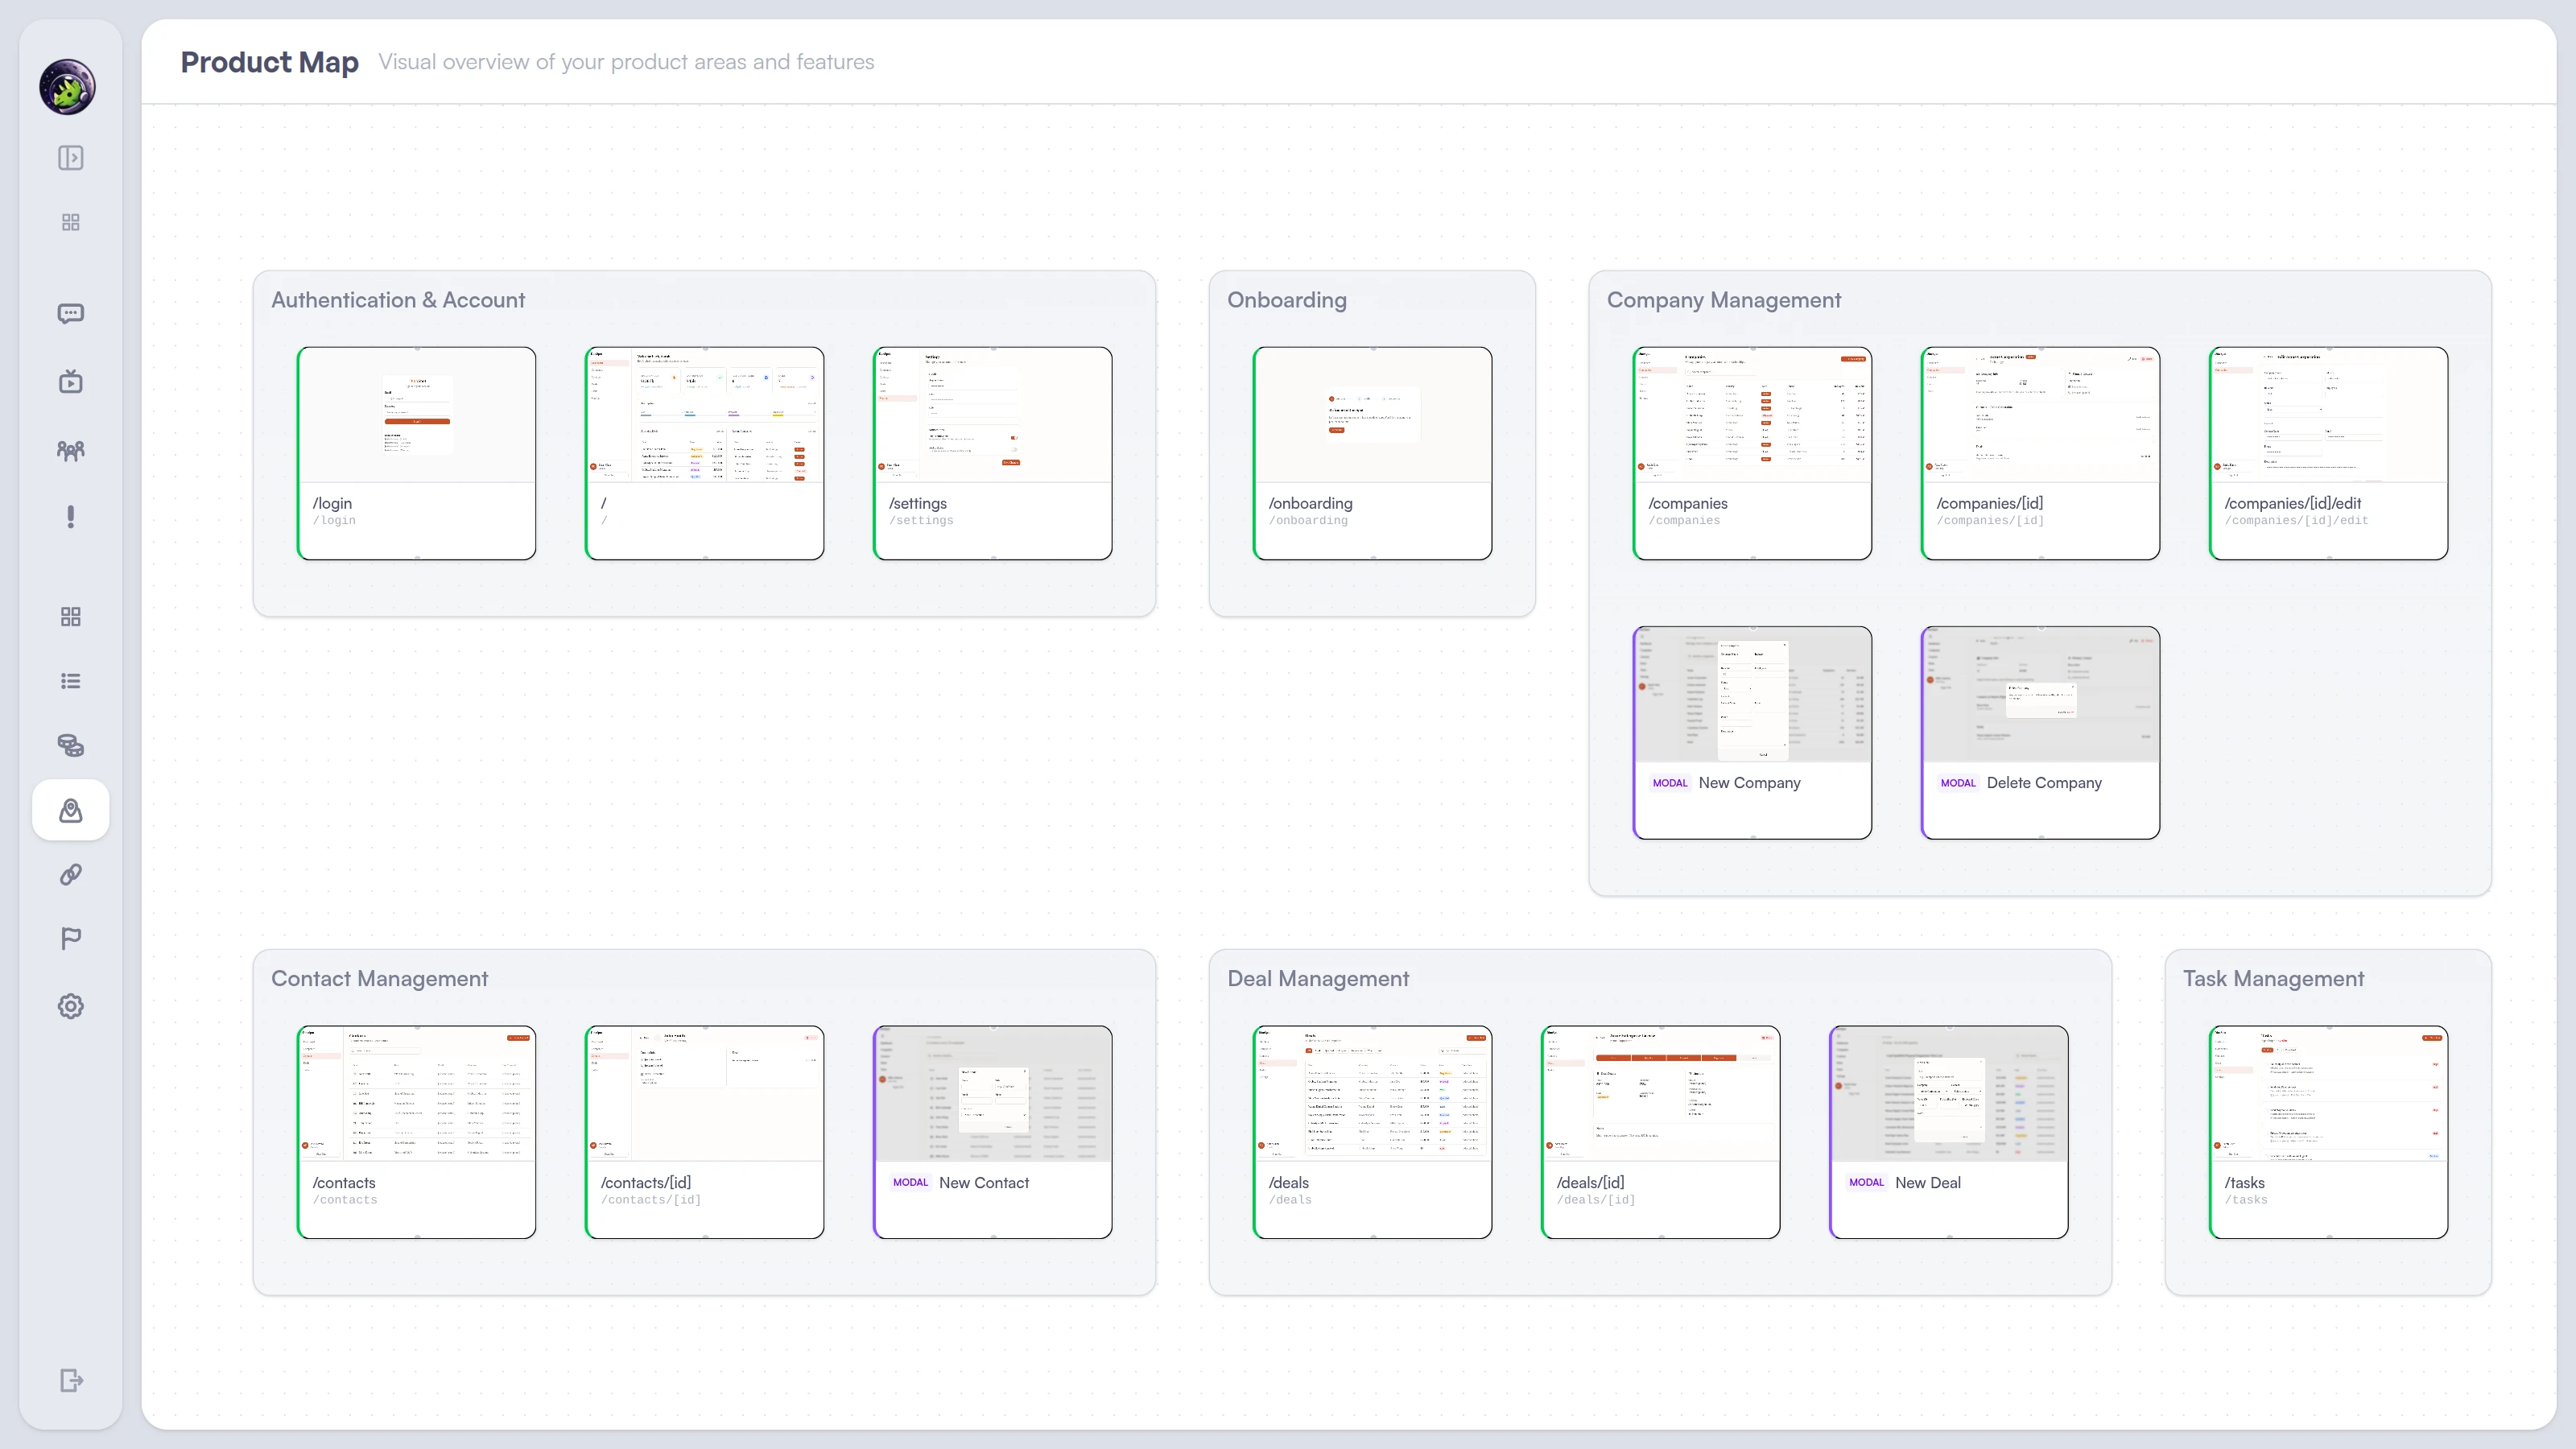
Your entire product structure (pages, modals, navigation flows) discovered automatically from real sessions.
Plus full session replay with journey markers and activation milestones on the timeline. Watch exactly what happened, in context.
Accounts to act on. Product fixes to ship.
The reason and the next step, every week.
The artifact
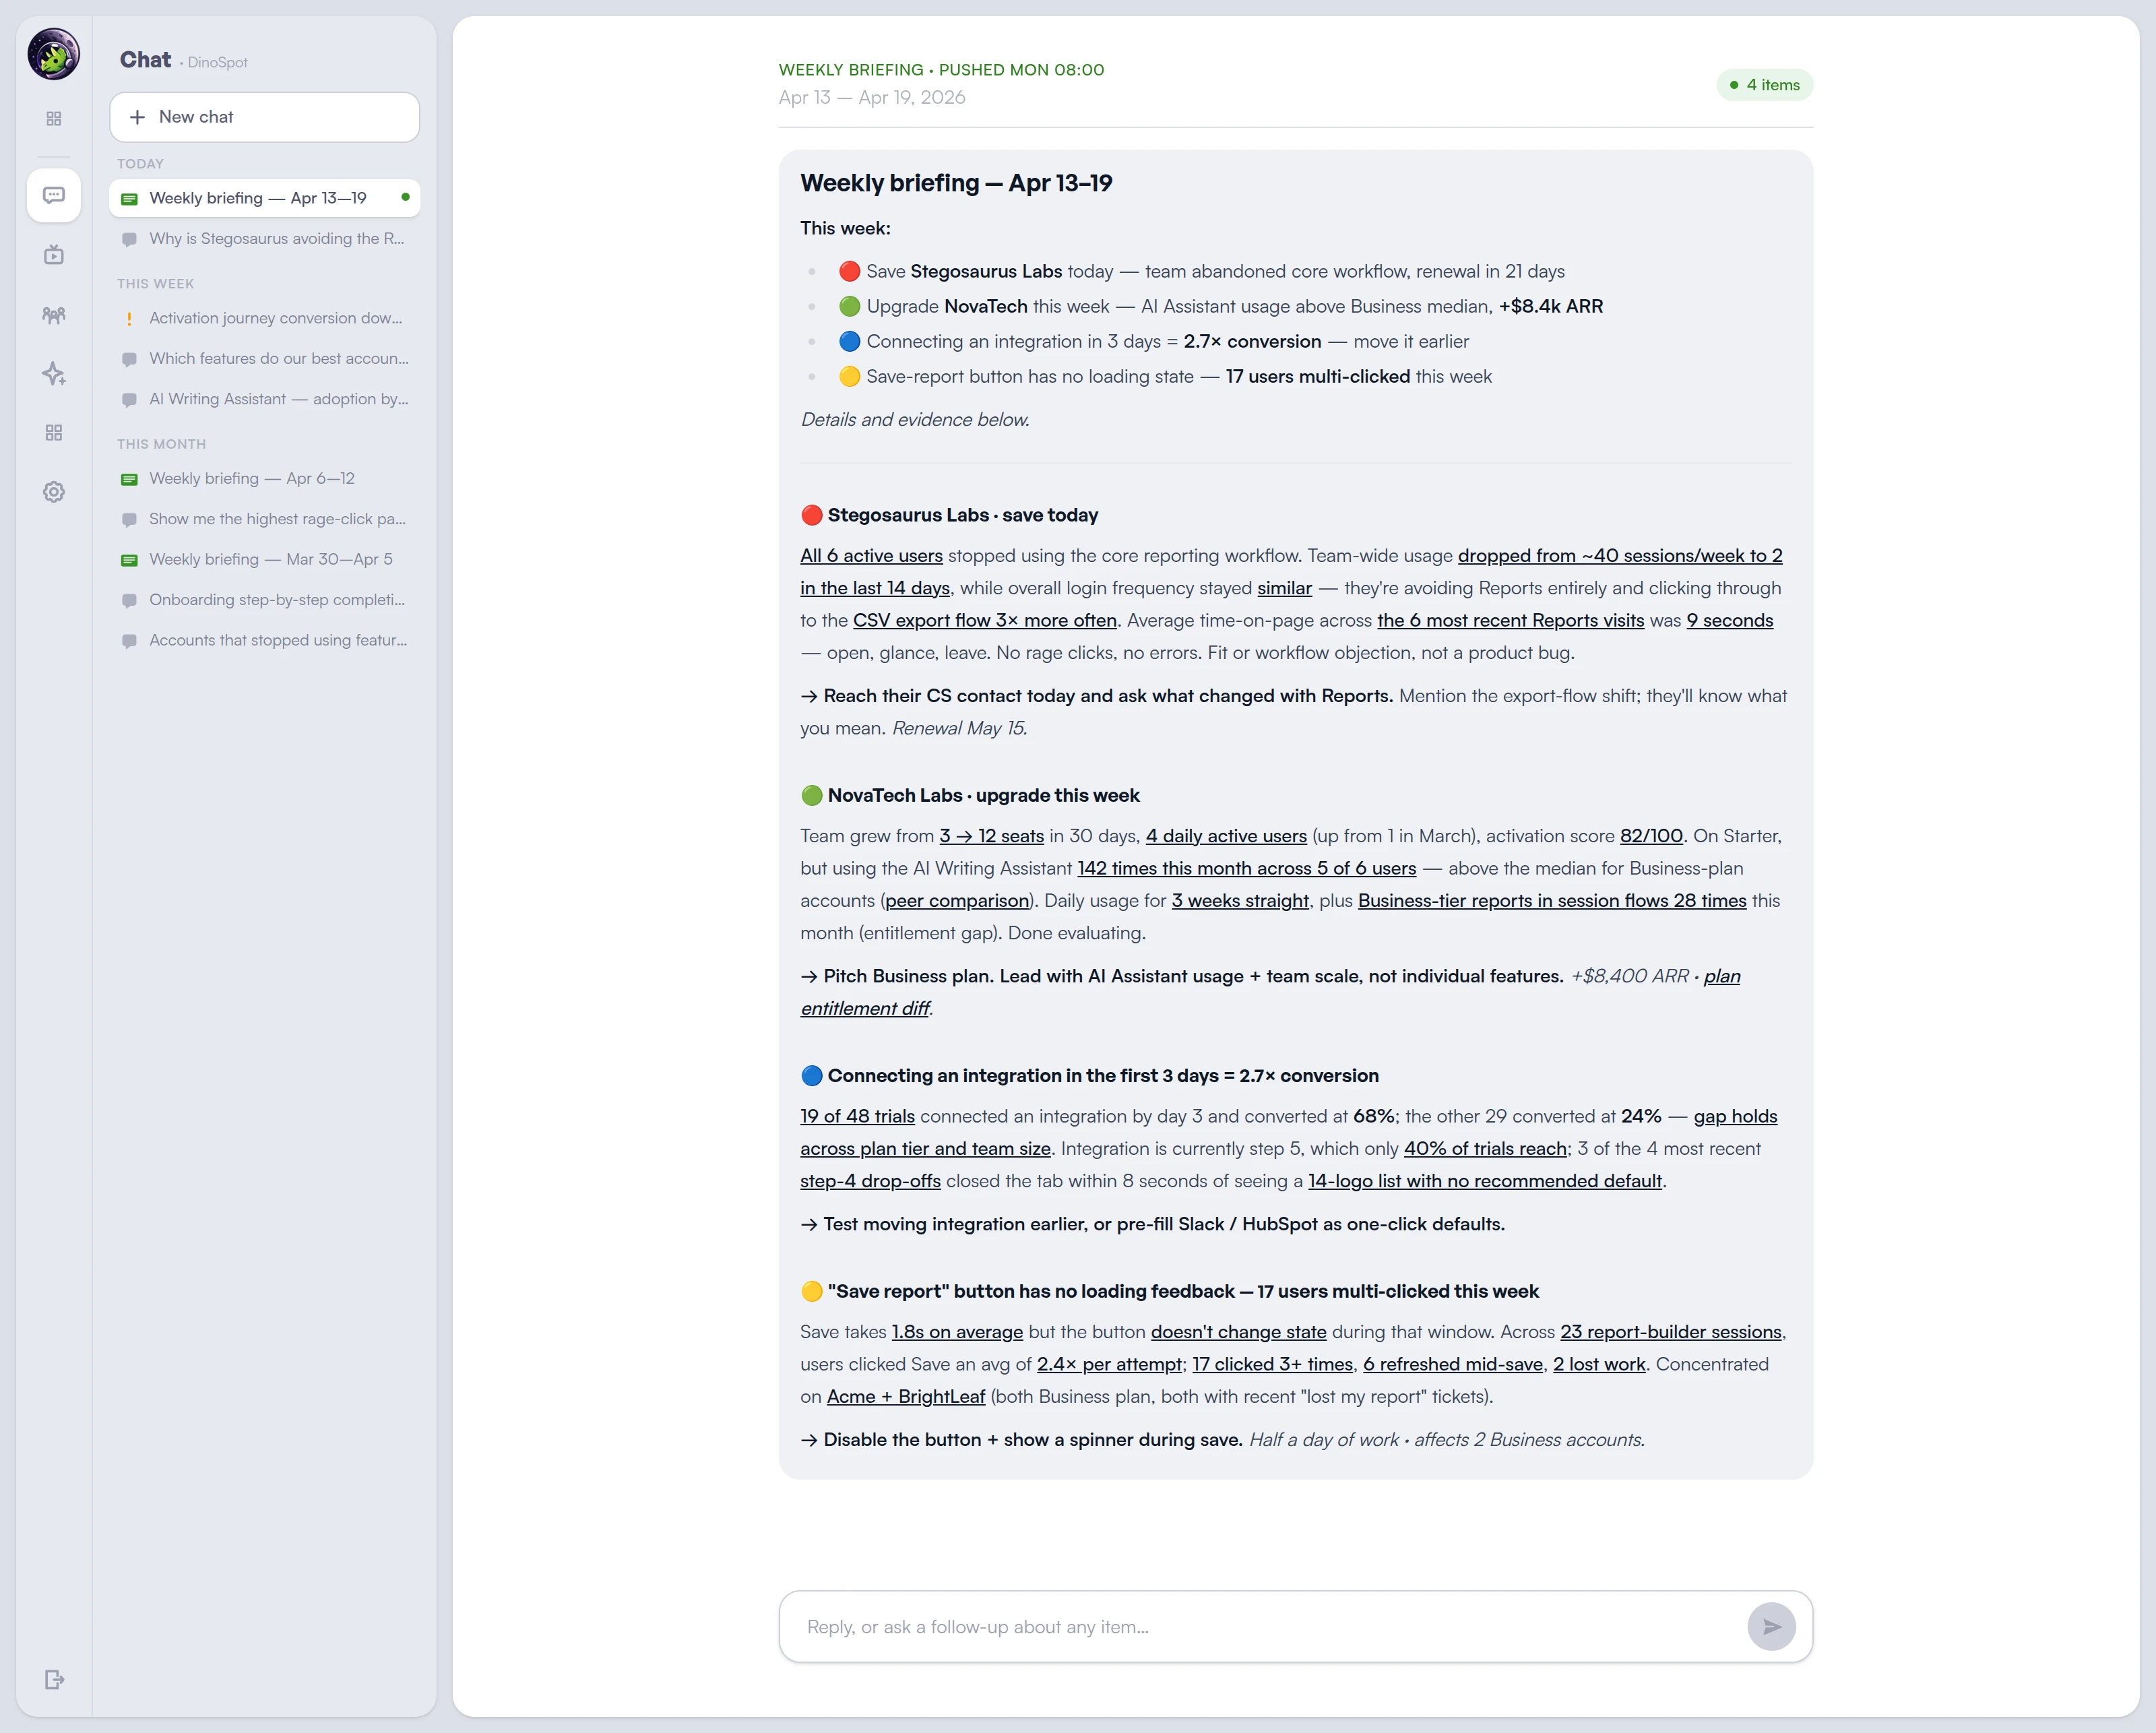
What lands in your inbox every Monday.
Five priorities across accounts and product. TL;DR up top, expanded items below. Every claim links to its evidence — session replays, screenshots, the underlying SQL.
Activation & conversion
Find what drives trial-to-paid conversion.
Which actions in the first week predict long-term retention? What do converting accounts do differently? Ask in plain English and get answers from your real product data.
Increase conversion
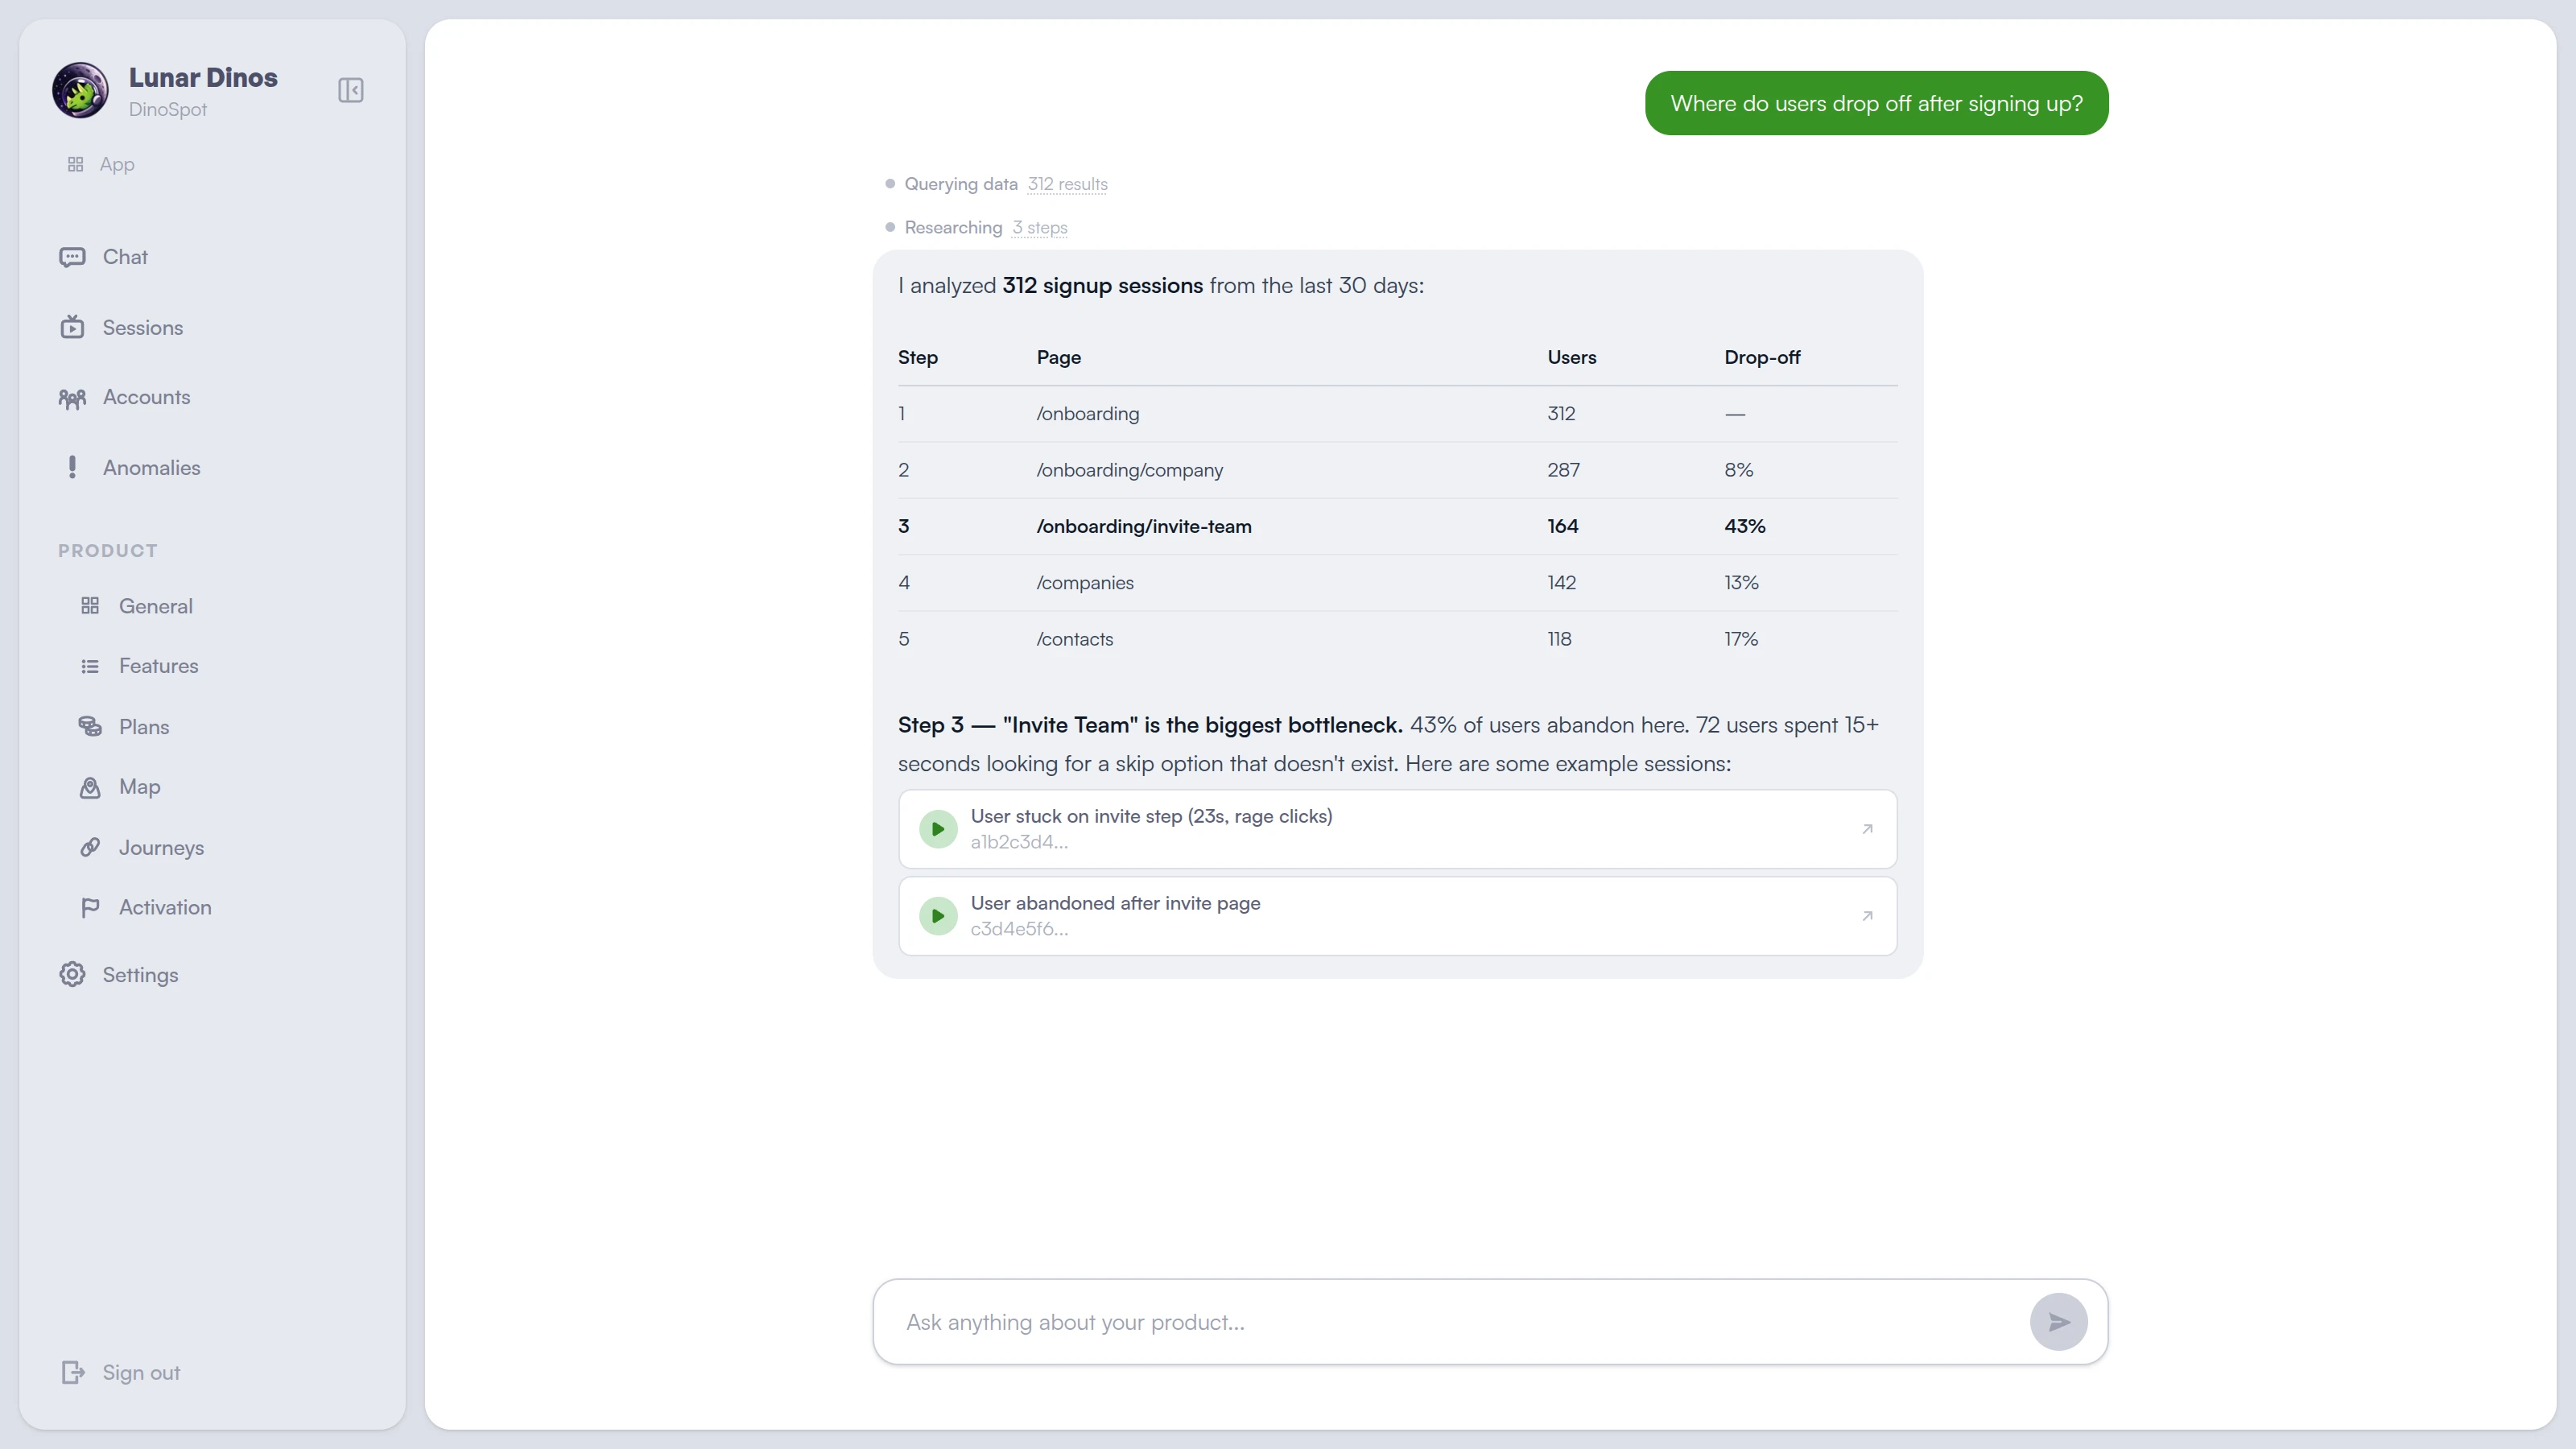
"Where do users drop off after onboarding?"
In a real example from one of our design partners, the AI pulled the 312 onboarding sessions from their last 30 days, identified the biggest drop-off at step 3, explained why users abandon, and linked to the session recordings. They knew exactly where to focus to lift conversion. Read the customer journey guide →
Build what drives retention
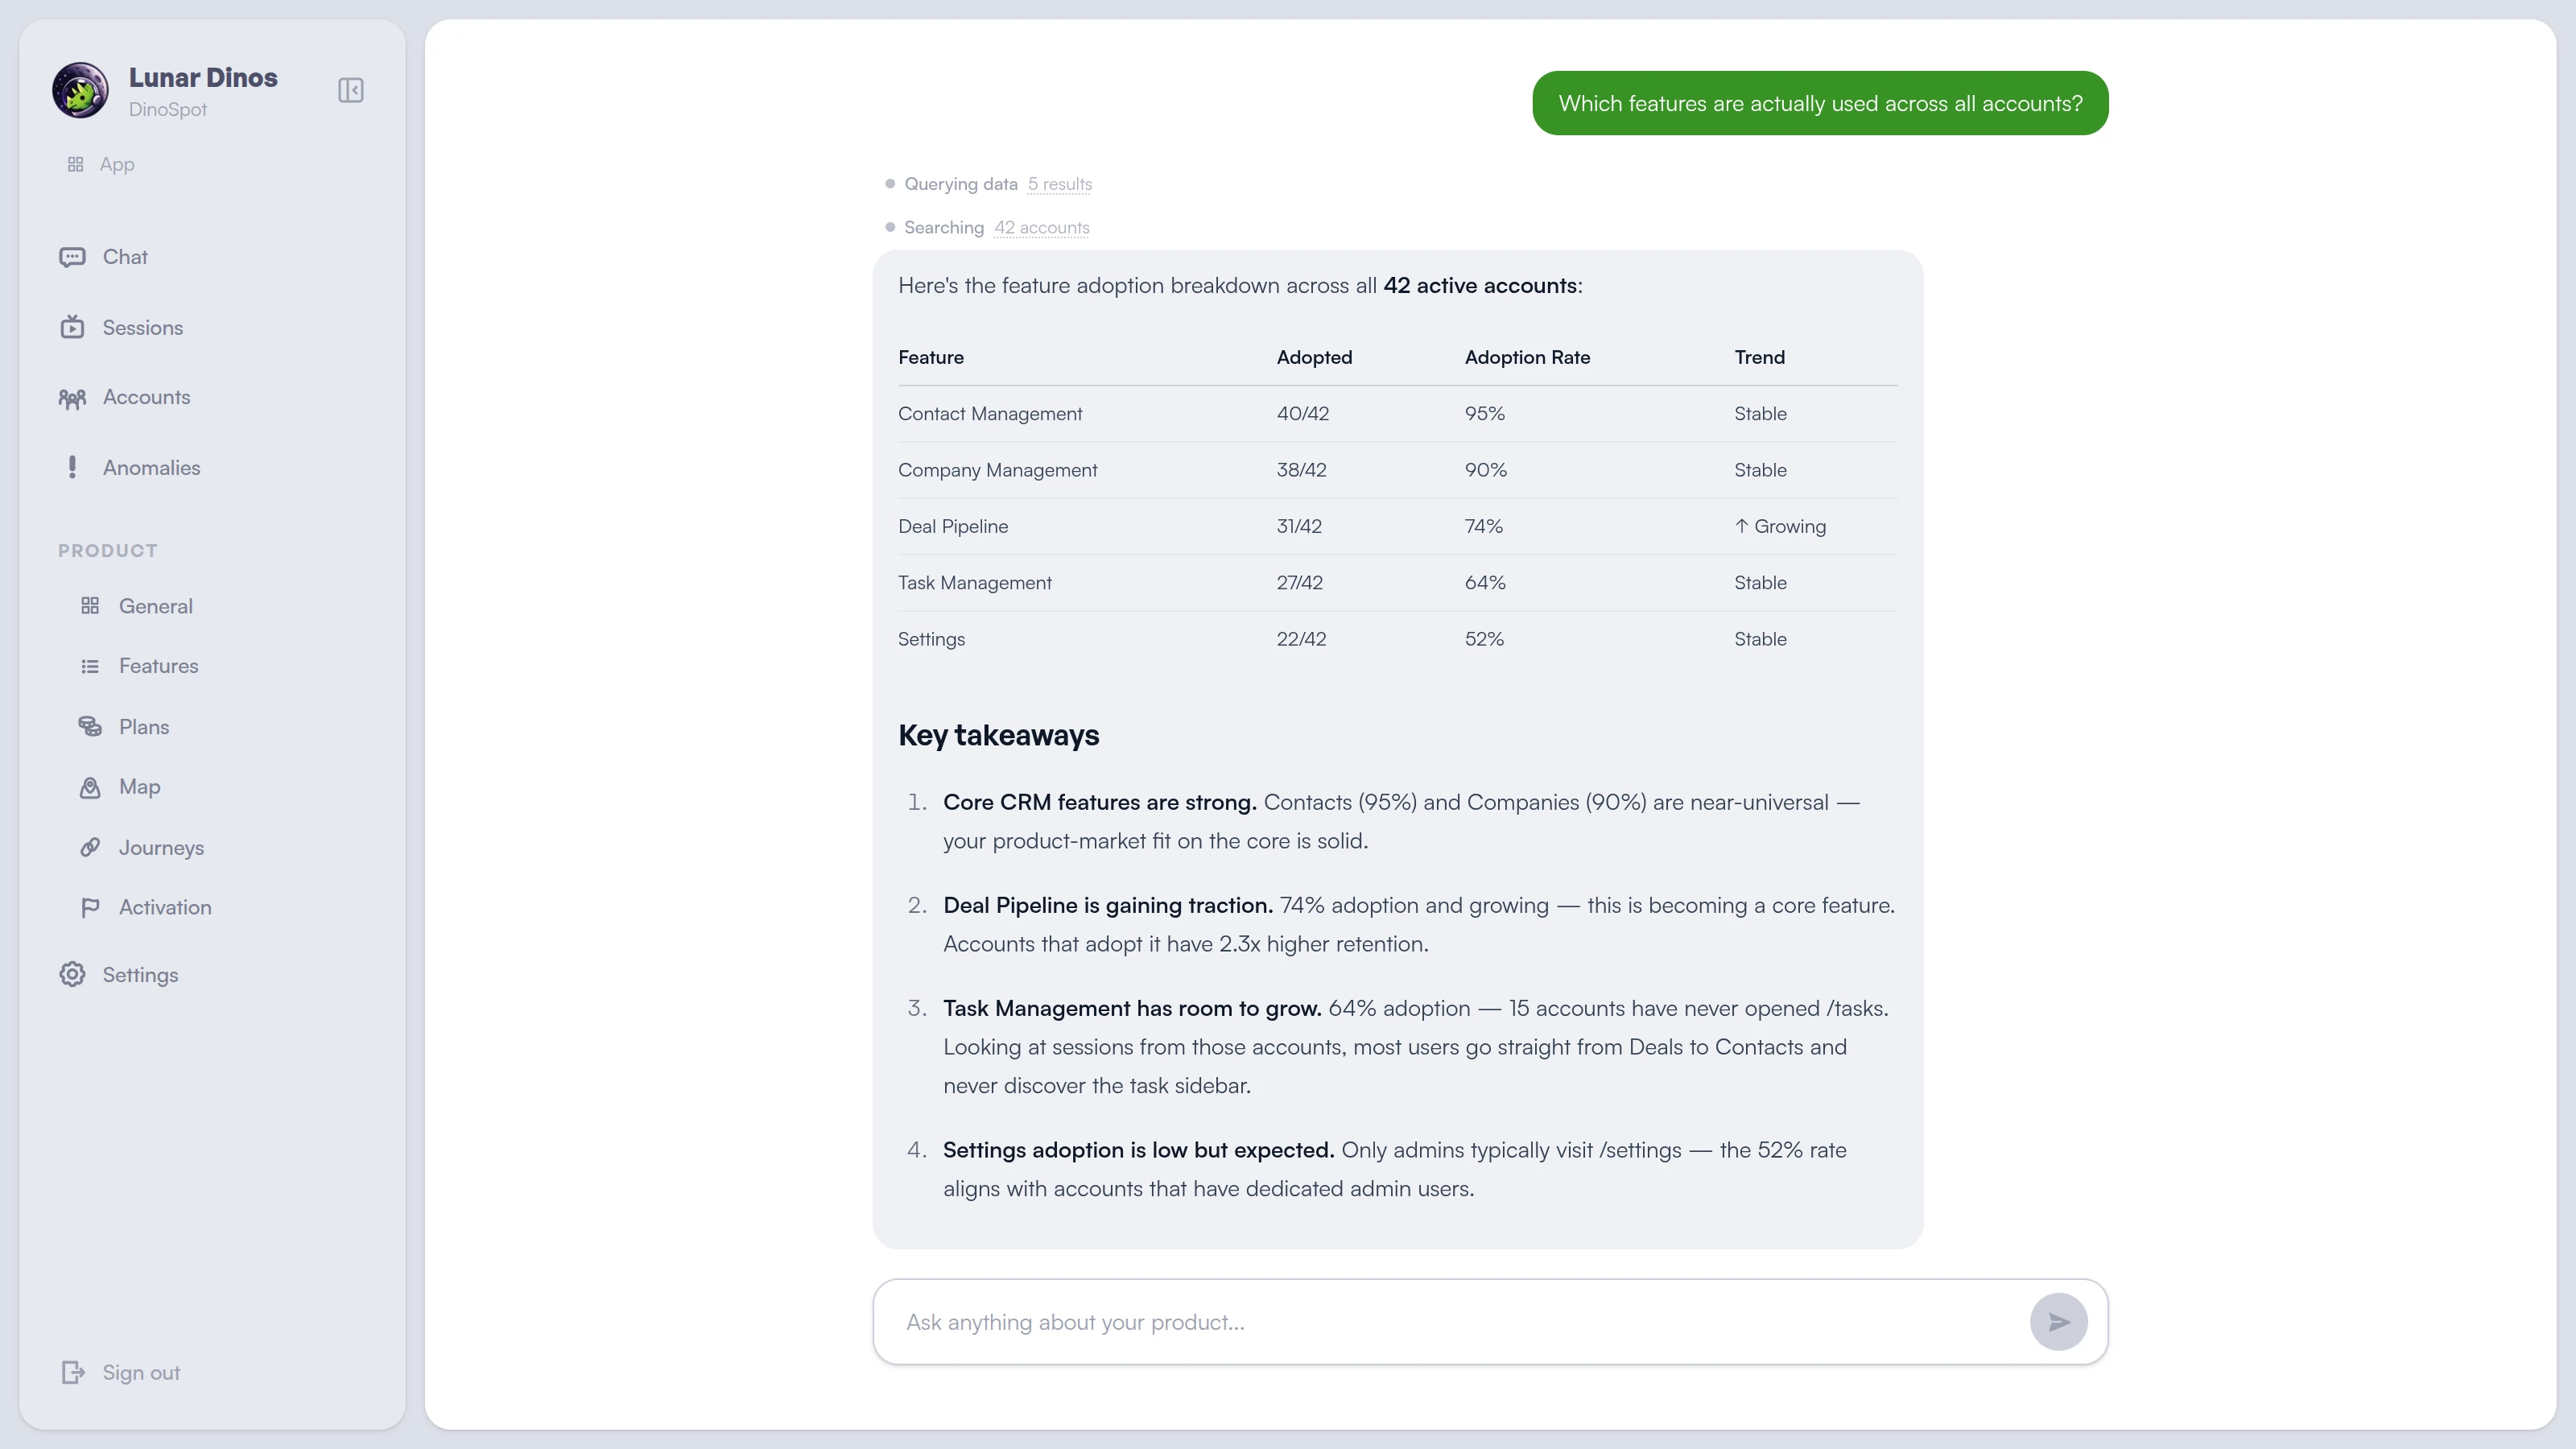
"Which features do retained accounts use that churned ones don't?"
Feature adoption correlated with retention and expansion outcomes across all accounts. See which features actually drive revenue and which ones get ignored.
Churn & expansion
Churn risk, weeks before cancel.
Upgrade-ready, with the talk track.
Account-level health from real product behavior. Churn signals flagged with the reason and the call to make. Upgrade-ready accounts surfaced with the CS talk track, not just a single-metric threshold.
The accounts shown below use illustrative names — the health scores, signals, and talk tracks are the real shape of what you'll see for your own customers.
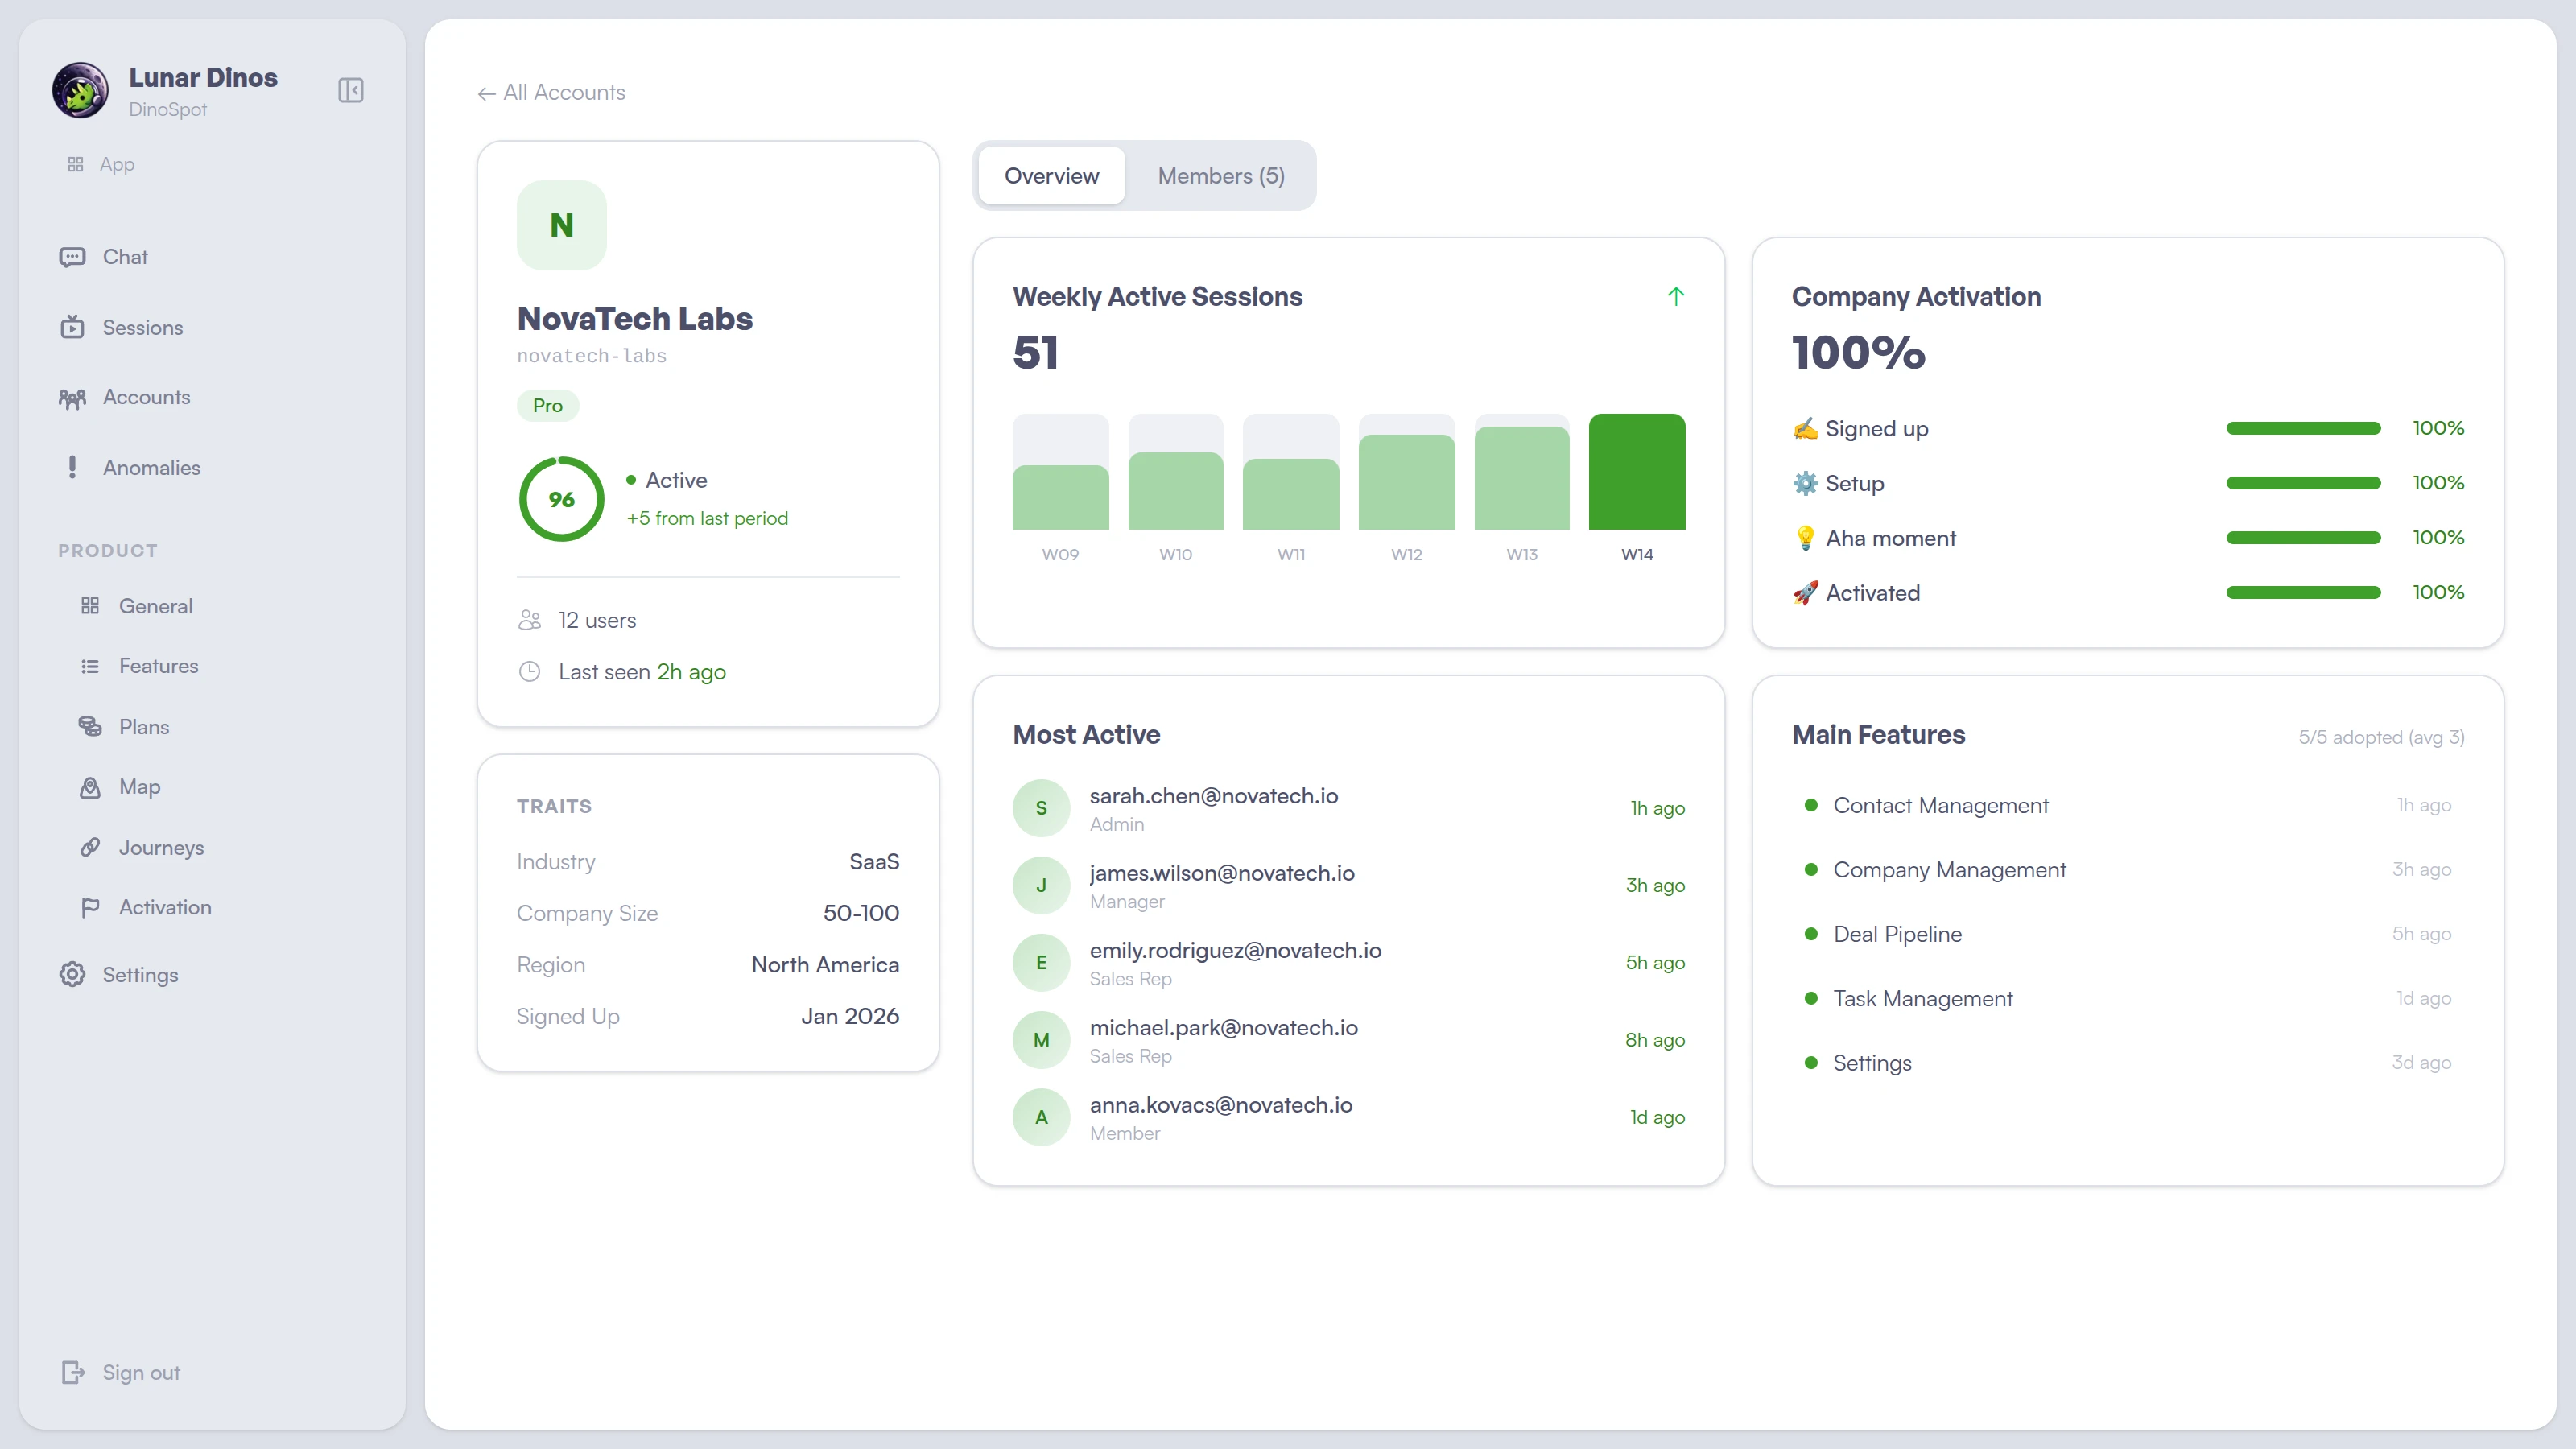
Expansion candidate — Health 96, 4 features active, hitting plan limits. Sales knows exactly who to call.
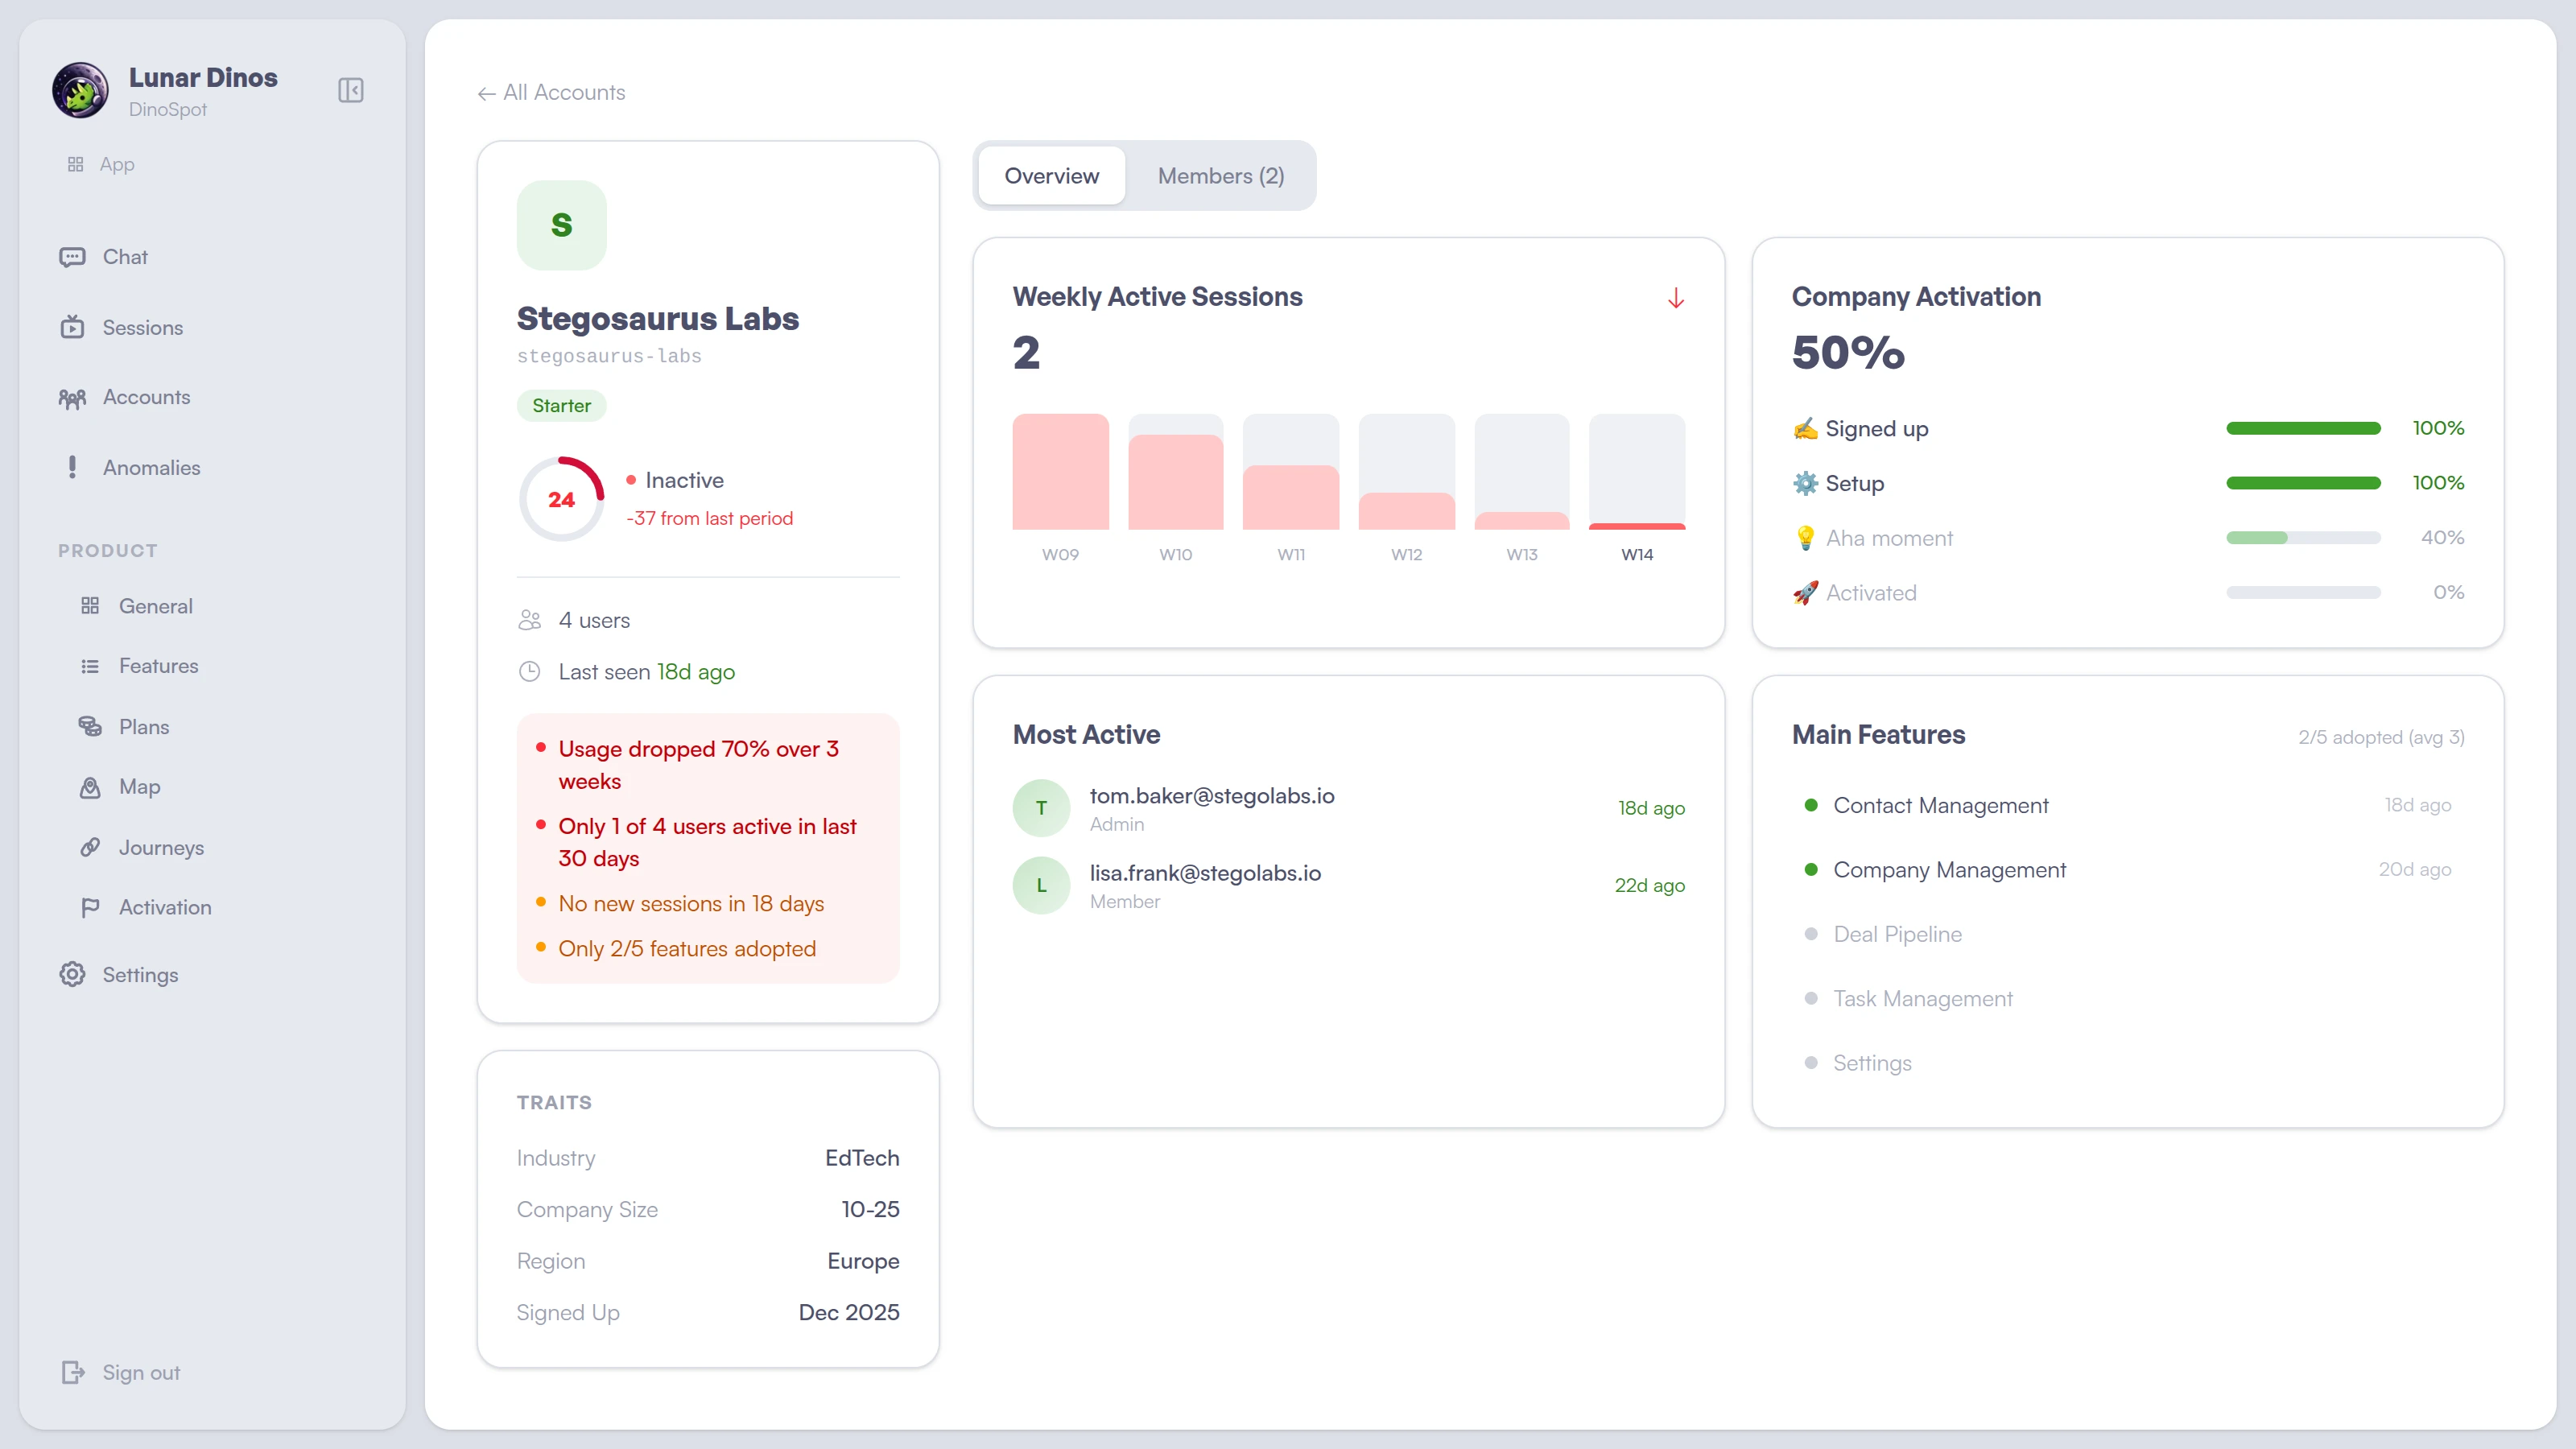
Churn risk — Health 24, usage dropped 70% in 3 weeks. CS intervenes before they cancel. The churn signals to watch →
Proactive intelligence
You don't have to ask. It tells you.
The best analytics tool is one you don't have to open. Lunar Dinos surfaces what matters before you think to look.
Weekly reports
What changed this week: new patterns, activation progress, accounts that need attention. In your inbox every Monday.
Actions, not threshold pings
Not "metric X crossed threshold Y". The full context — which champion went dark, which feature stopped getting used, or which UX step is leaking — plus who on your team should do what.
Delivered in Slack
Weekly actions, account flags, and product signals delivered in the channel your team already lives in. No new tool to open.
Answered automatically
The questions that drive revenue.
Answered every week — for every account and across your product. Ask follow-ups ad-hoc when you want to go deeper.
Or skip the question. Tell your coding agent the outcome you want — Lunar Dinos grounds the fix in real product data.
> What's the highest-leverage code change I could ship this week to
  move revenue? Use lunar-dinos to back it with data.

● I'll look at where revenue is leaking right now — stalled trials,
  churn signals, and recent regressions — then pick the fix with the
  biggest delta.

● lunar-dinos - ask (MCP)
  ⎿  "which product regressions this month correlate with conversion drop?"
     Running: changes(since=30d) → query(events, funnel by release)

     Step 2 → step 3 onboarding completion fell 74% → 51% on Apr 8.
     Correlates with PR #1204 removing the "Skip for now" button on
     /onboarding/connect. 74 sessions abandoned there since; 12 in
     the 30 days prior. Trial-to-paid on that cohort is trending
     -18% week over week.

● lunar-dinos - screenshot (MCP)
  ⎿  route_pattern: /onboarding/connect
     [Image #1 — /onboarding/connect, step 2, no skip affordance]

● Highest-leverage change: restore the skip path on
  /onboarding/connect, but gate it behind a "remind me later" state
  so we don't lose the integration prompt entirely.

  Estimated impact from the pre-Apr-8 baseline: recovering ~23pp of
  step 2→3 completion on ~260 weekly trials ≈ 40–50 additional
  activated accounts/week.

  Plan:
    1. Add SkipLaterButton to OnboardingConnect.tsx
    2. Persist dismissal in onboarding_state, re-prompt on day 3
    3. Emit onboarding_skipped event so lunar-dinos can track recovery

  Proceed?

> go

● Edit(apps/web/src/onboarding/OnboardingConnect.tsx)
  ⎿  Added SkipLaterButton, wired dismissal state.  (+34 −2)
▋
Works with Claude Code, Cursor, ChatGPT, VS Code, and any MCP-compatible client. See the founder workflow →
vs. the market
They answer what you ask. We find what you missed.
PostHog has a great AI chat — if you know what to ask, about which account, on which Monday. We tell you what to act on proactively — accounts to call and product fixes to ship — every week.
Amplitude shipped 5 AI agents in 2026 — none dedicated to weekly action recommendations. Telling you what to act on each week is the whole product.
Pendo tracks feature clicks. No feature-adoption vs. retention action per account. We correlate adoption with retention and expansion, and name who's falling behind on your new features.
Heap auto-captures everything. You still have to decide what matters. We name what needs action — with the reason and the next step.
Fullstory shows what happened in a session. Doesn't roll up to weekly actions. Session replay connected to the week's priorities, not just rage clicks.
Built in Hamburg. Hosted in Europe.
Made and hosted in the EU, powered by European-based infrastructure.
Why we're building this

"Every B2B SaaS team I talk to already has PostHog or Amplitude. They can answer any question you ask — if you know to ask, in the right account, in the right week. Founders don't have that kind of time. That's the gap Lunar Dinos was built for."
Andre Sattler
Founder & CEO · Lunar Dinos · Hamburg, Germany
Frequently asked
Questions we hear a lot.
What is proactive product analytics?
Proactive product analytics is a new category that tells you what needs action this week, with the reason and the next step — instead of waiting for you to ask. Two pillars: which accounts need attention (churn risk, upgrade-ready, stalled trial) and which product changes would move the needle (friction patterns, retention-driving features, onboarding drop-offs).
How is Lunar Dinos different from PostHog AI or Amplitude Agents?
PostHog AI and Amplitude Agents answer questions you type into a chat. That works if you know what to ask. Lunar Dinos is proactive: it tells you what to act on this week — accounts to call and product fixes to ship — each with the reason and the next step, without anyone typing a prompt.
Who is Lunar Dinos for?
Founders, product teams, and customer success teams at Series A to B B2B SaaS companies. Anyone who needs to know which accounts to act on this week — with the story and next step ready to go.
Where is my product data stored?
Lunar Dinos is built in Hamburg, Germany and hosted in Europe on European infrastructure. Your product data never leaves the EU.
What kind of B2B SaaS teams is Lunar Dinos for?
Series A to B B2B SaaS companies, 20 to 150 people, with a product and revenue to protect and no bandwidth to query analytics every week. Not built for B2C, enterprise teams with dedicated data teams, or pre-product startups.
Know what to act on. Take the next step.
Accounts to call, product fixes to ship — each with the reason and the next step, delivered every week.
Built in Hamburg, Germany. Hosted in Europe.
| 14-day free trial