Know which features
actually drive retention.
Which features do retained accounts use that churned ones don't? Where do your strongest accounts get stuck? Which silent users are worth interviewing this week — and what should you ask them? Feature adoption, activation, and user research hooks, delivered per account every week.
Product decisions deserve evidence, not gut feeling.
You're making roadmap decisions every week. The data to back them up is locked behind a bottleneck.
Feature adoption is a blind spot
You shipped a feature last quarter. Is it driving retention? Is it correlated with upgrades? Connecting adoption to outcomes across accounts is the work nobody gets to.
User research hits the same ten people
The most valuable product insights come from user conversations — but most teams talk to the same loud champions every time. The silent accounts with surprising behavior never get on the call list.
Roadmap is opinion-driven
The founder wants X, the loudest customer wants Y, you think Z matters most. Without evidence on what actually moves retention and expansion, sprint planning becomes a debate.
The Monday briefing for product teams
The friction patterns, retention signals, and adoption gaps worth acting on this week — each with the data behind it and a specific next step.
From behavior to decisions
Lunar Dinos connects feature adoption to business outcomes. Automatically.
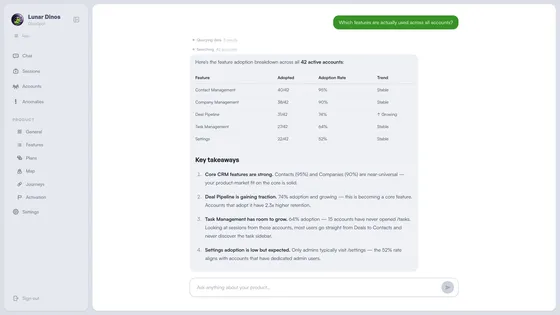
Which features drive retention?
Feature adoption correlated with retention and expansion outcomes across all accounts. See which features retained accounts use that churned ones don't, and which ones are underperforming.
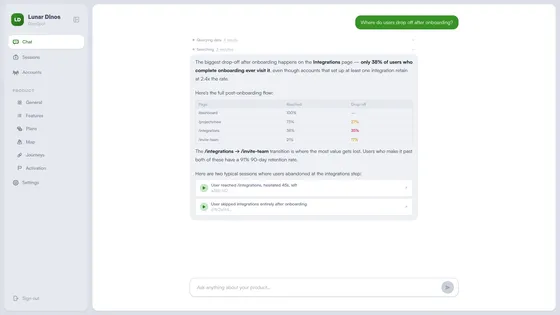
Find activation bottlenecks
Where do users drop off in onboarding? What do converting trials do differently in their first week? The AI analyzes real sessions and shows you exactly where to focus to improve conversion.
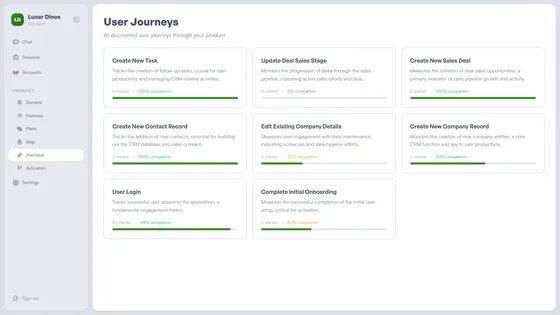
User journeys with completion rates
Every key flow mapped with drop-off points, discovered automatically. See where users get stuck, which paths lead to activation, and where the product creates friction.
Back your roadmap with evidence
"Accounts that adopt feature Z retain 40% better. 60% of accounts haven't discovered it." That's the kind of insight that settles roadmap debates and focuses engineering time on what actually moves the needle.
What lands in your Monday inbox
Each briefing names the pattern, points to the accounts showing it, and suggests the next product move — or the user to interview.
Feature signal
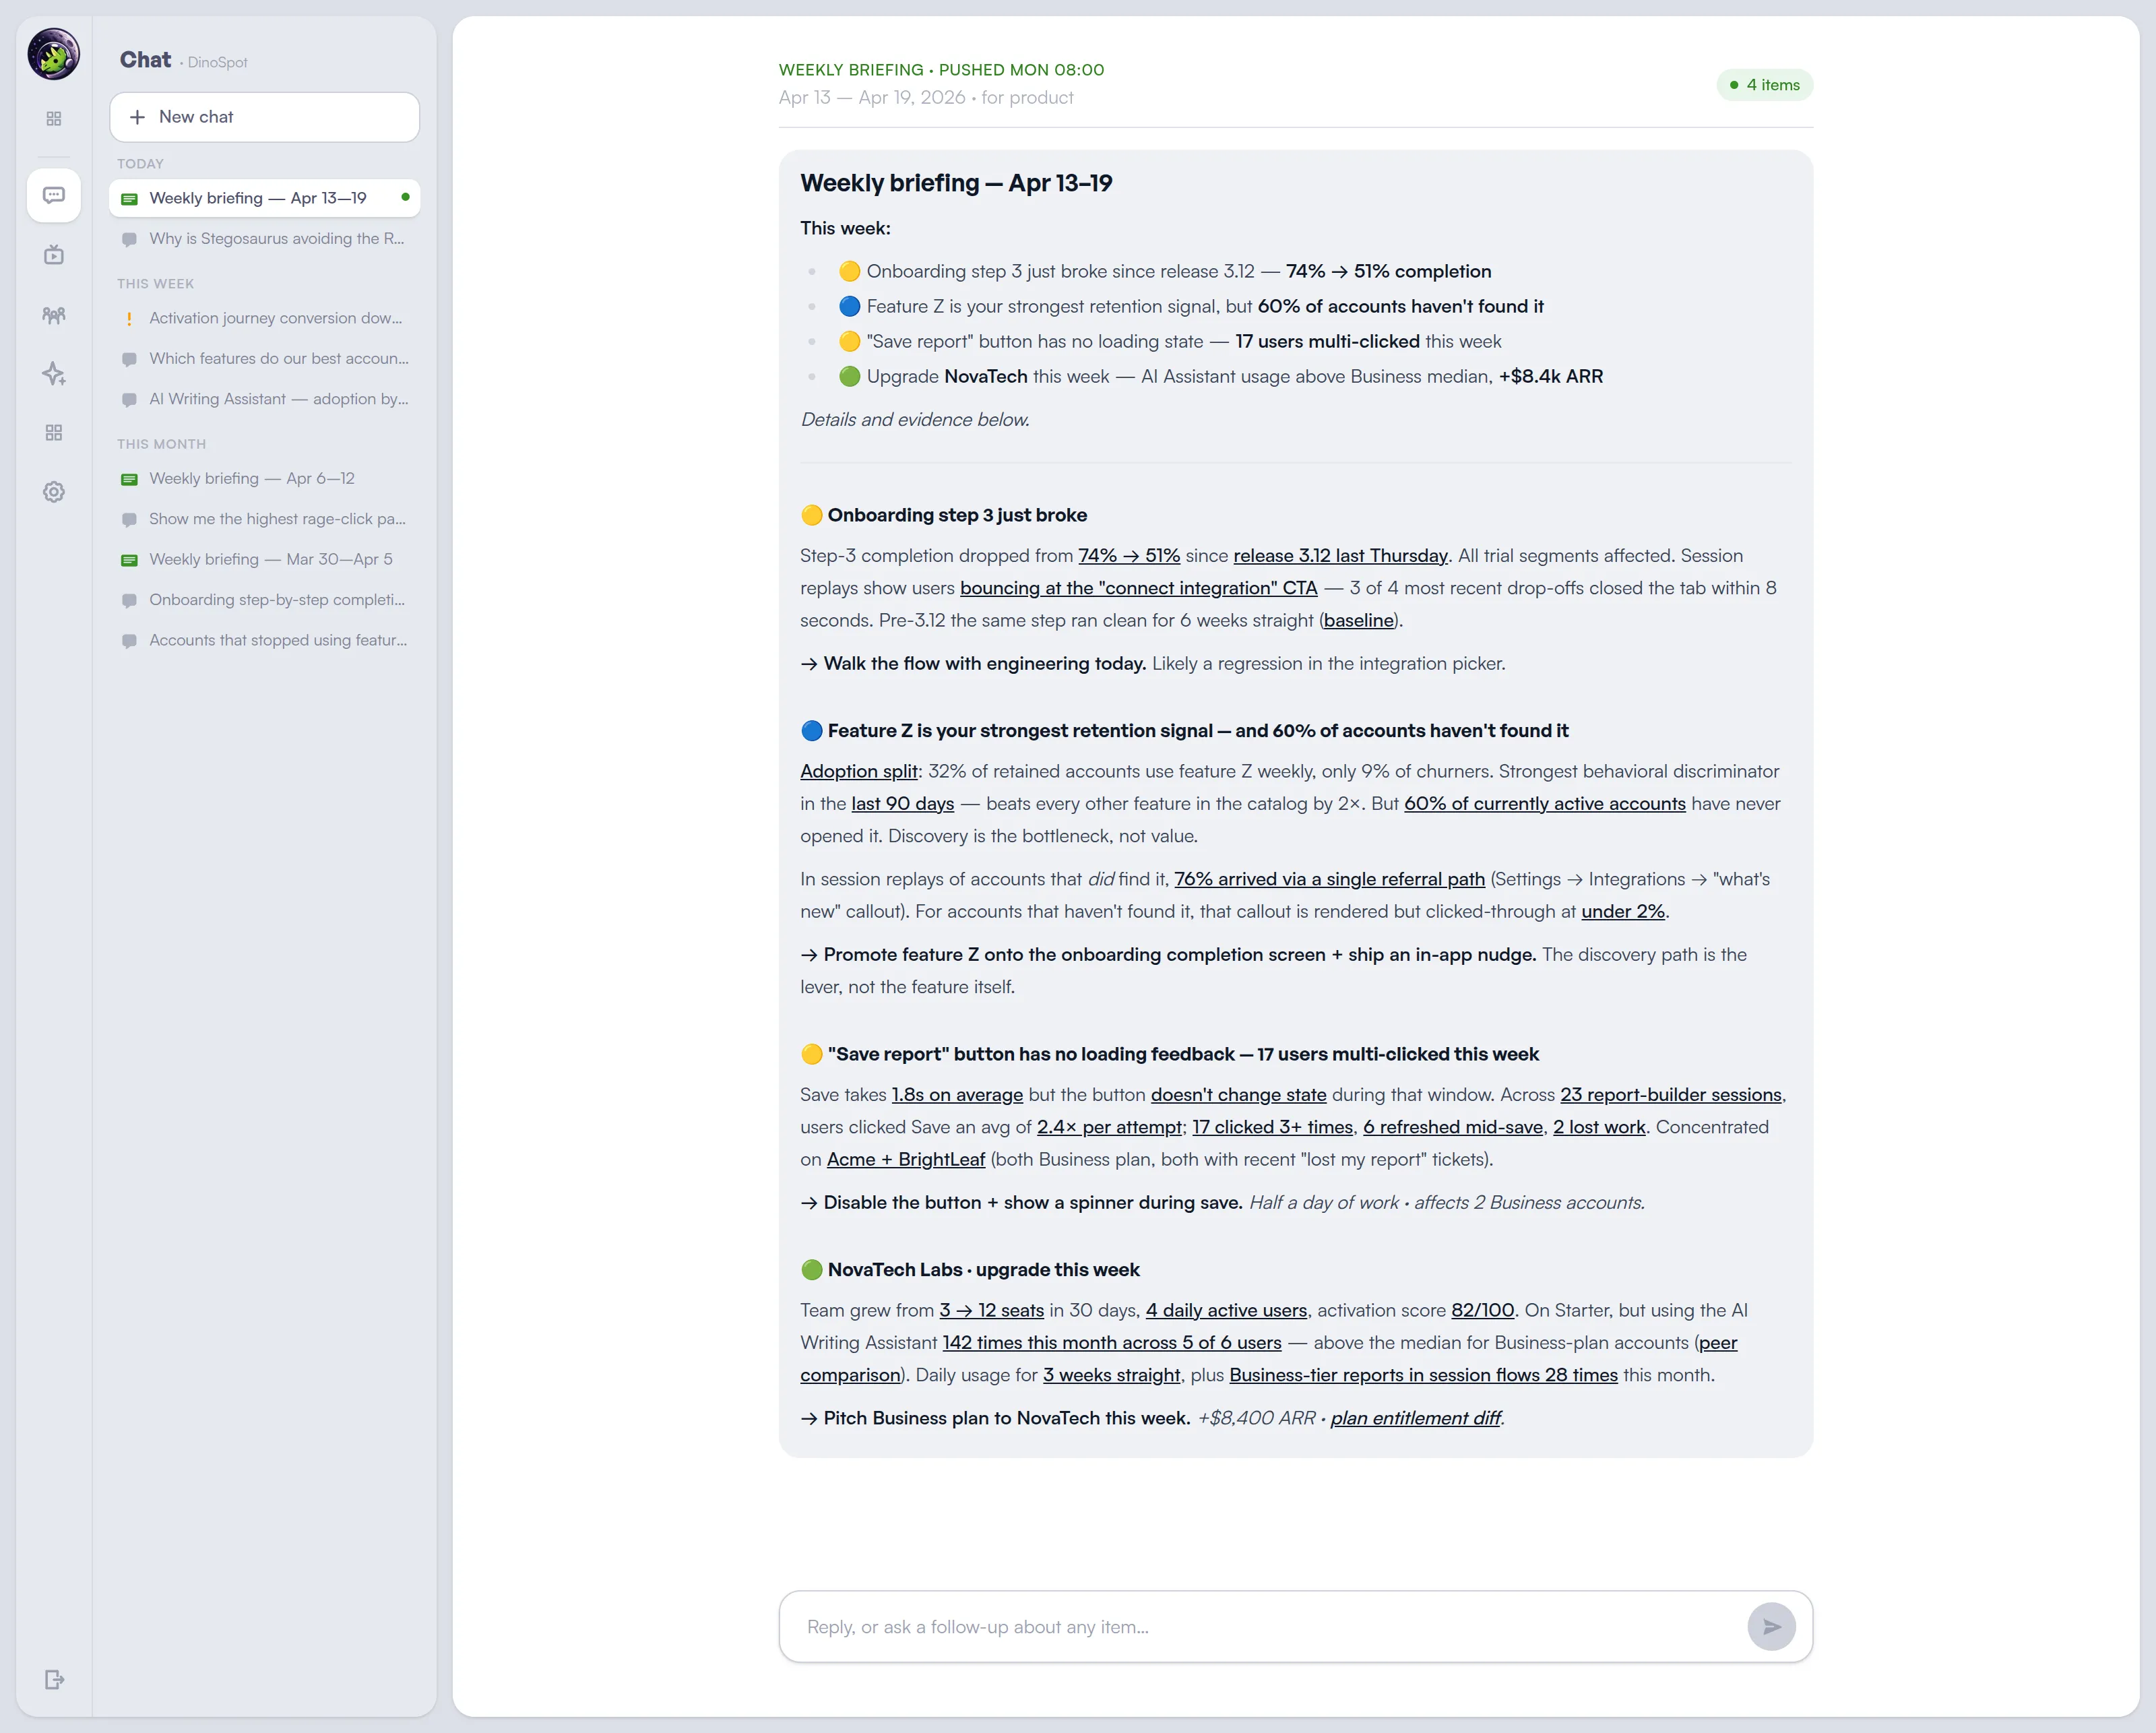
"Feature Z adopted by 32% of retained accounts, only 9% of churners. Strong retention correlation — but 60% of active accounts haven't discovered it."
→ PM runs an enablement push + in-app nudge.
Activation break
"Onboarding step 3 completion dropped from 74% to 51% since release 3.12 last Thursday."
→ PM checks the flow with engineering today.
User conversation hook
"Fern Labs is your 2nd-largest account but uses only 3 of 12 core features. They skip the Reports module entirely."
→ PM interviews their admin this week. Ask: why no reports?
Friction pattern
"Across all trials, 40% abandon the project-setup wizard at the 'invite team' step. Single biggest leak in activation."
→ PM drafts a roadmap proposal to make invites optional.
Frequently asked questions
How is Lunar Dinos different from traditional product analytics?
Traditional tools answer queries you type. Lunar Dinos delivers feature-adoption-to-retention correlations, activation patterns per account, and surprising-user hooks as weekly findings, without building dashboards or writing queries.
Can I run user research on top of Lunar Dinos?
Yes. Each weekly briefing names specific silent or surprising users with a conversation hook, so your next interview round is surgical instead of talking to the same loud champions again.
Does it integrate with Slack and our CRM?
Briefings are delivered to Slack. HubSpot sync for usage data and power-user identification is on the roadmap.
Does Lunar Dinos replace PostHog, Amplitude, or Mixpanel?
For B2B SaaS teams that care about which features drive retention per account and which users to talk to this week, yes. Teams that need feature flags, A/B testing, SQL-level exploration, or warehouse-native queries often keep their existing tool alongside Lunar Dinos.
Will AI replace PM judgement?
No. Lunar Dinos surfaces the evidence per account and per feature. The PM still decides what to build. The goal is to shorten the loop between real user behavior and roadmap decisions.
Build what actually drives retention.
Feature adoption correlated with retention. Activation patterns per account. The silent users worth interviewing this week.
Read more: Your Product Data Has Answers