See churn risk before renewal,
not at renewal.
Behavioral churn prediction for B2B SaaS, without a data analyst. Lunar Dinos watches the patterns that precede cancellation by two to six weeks (login frequency drops, feature abandonment, champion silence) and tells you which accounts to call this week, and what to say.
Why churn keeps surprising you
In B2B SaaS, the warning signs are in product data 2–6 weeks before cancellation. Most teams don't see them until the renewal call.
Renewal-driven detection
Most CS motions trigger 30 days before renewal. By then, the account has already decided. The behavior changes that predicted it started 6–8 weeks earlier and nobody was watching.
Health scores by gut feel
The CS spreadsheet says "green" because last quarter's NPS came back at 8. Meanwhile, login frequency dropped 60% and the admin hasn't opened the app in 11 days. NPS is a lagging indicator.
Threshold alerts, no context
"Active users dropped 15% this week" across 80 accounts. Which ones? Why? Who needs a call? That's a multi-day analyst project, every week. So nobody runs it.
The four signals that actually predict churn
Four patterns repeat across B2B SaaS churn. Each is weak alone. The combination, ranked per account, is the highest-signal early-warning system you can build from product data.
1 · Login frequency drop
Daily users going weekly, weekly going monthly. The earliest signal: fires 4–6 weeks before cancellation in most B2B accounts.
"Diplodocus Health: admin Mira logged 21 sessions in March, 4 in the last 30 days. Zero so far this week."
2 · Core workflow abandonment
The feature the account onboarded around stops getting used. They're paying for something they're no longer doing. That bill is the next thing they cancel.
"Trilobite Labs: reporting workflow ran 4×/day for 3 months, then nothing for 12 days. They bought us for reporting."
3 · Champion silence
The person who bought goes dark. Either they left the company or they've moved on internally. Both routes lead to "let's reevaluate this contract."
"Pangaea: original buyer Ben hasn't logged in 19 days. Two new users joined last week and haven't been onboarded."
4 · Team contraction
Fewer seats active week-over-week. Often invisible because the seat count on the contract didn't change. Only the people actually using them did.
"Fern Labs: 8 active users last month, 5 this month, 3 this week. Same 10 paid seats."
Each signal alone has high false-positive rate. Combined and ranked per account, they catch the at-risk renewals 6–8 weeks ahead of the renewal call, when there's still time to do something about it.
The Monday churn brief
The churn-risk accounts ranked by signal combination, each with the intervention window remaining and the call that still saves the renewal. The whole save-the-renewal motion in one Monday artifact.
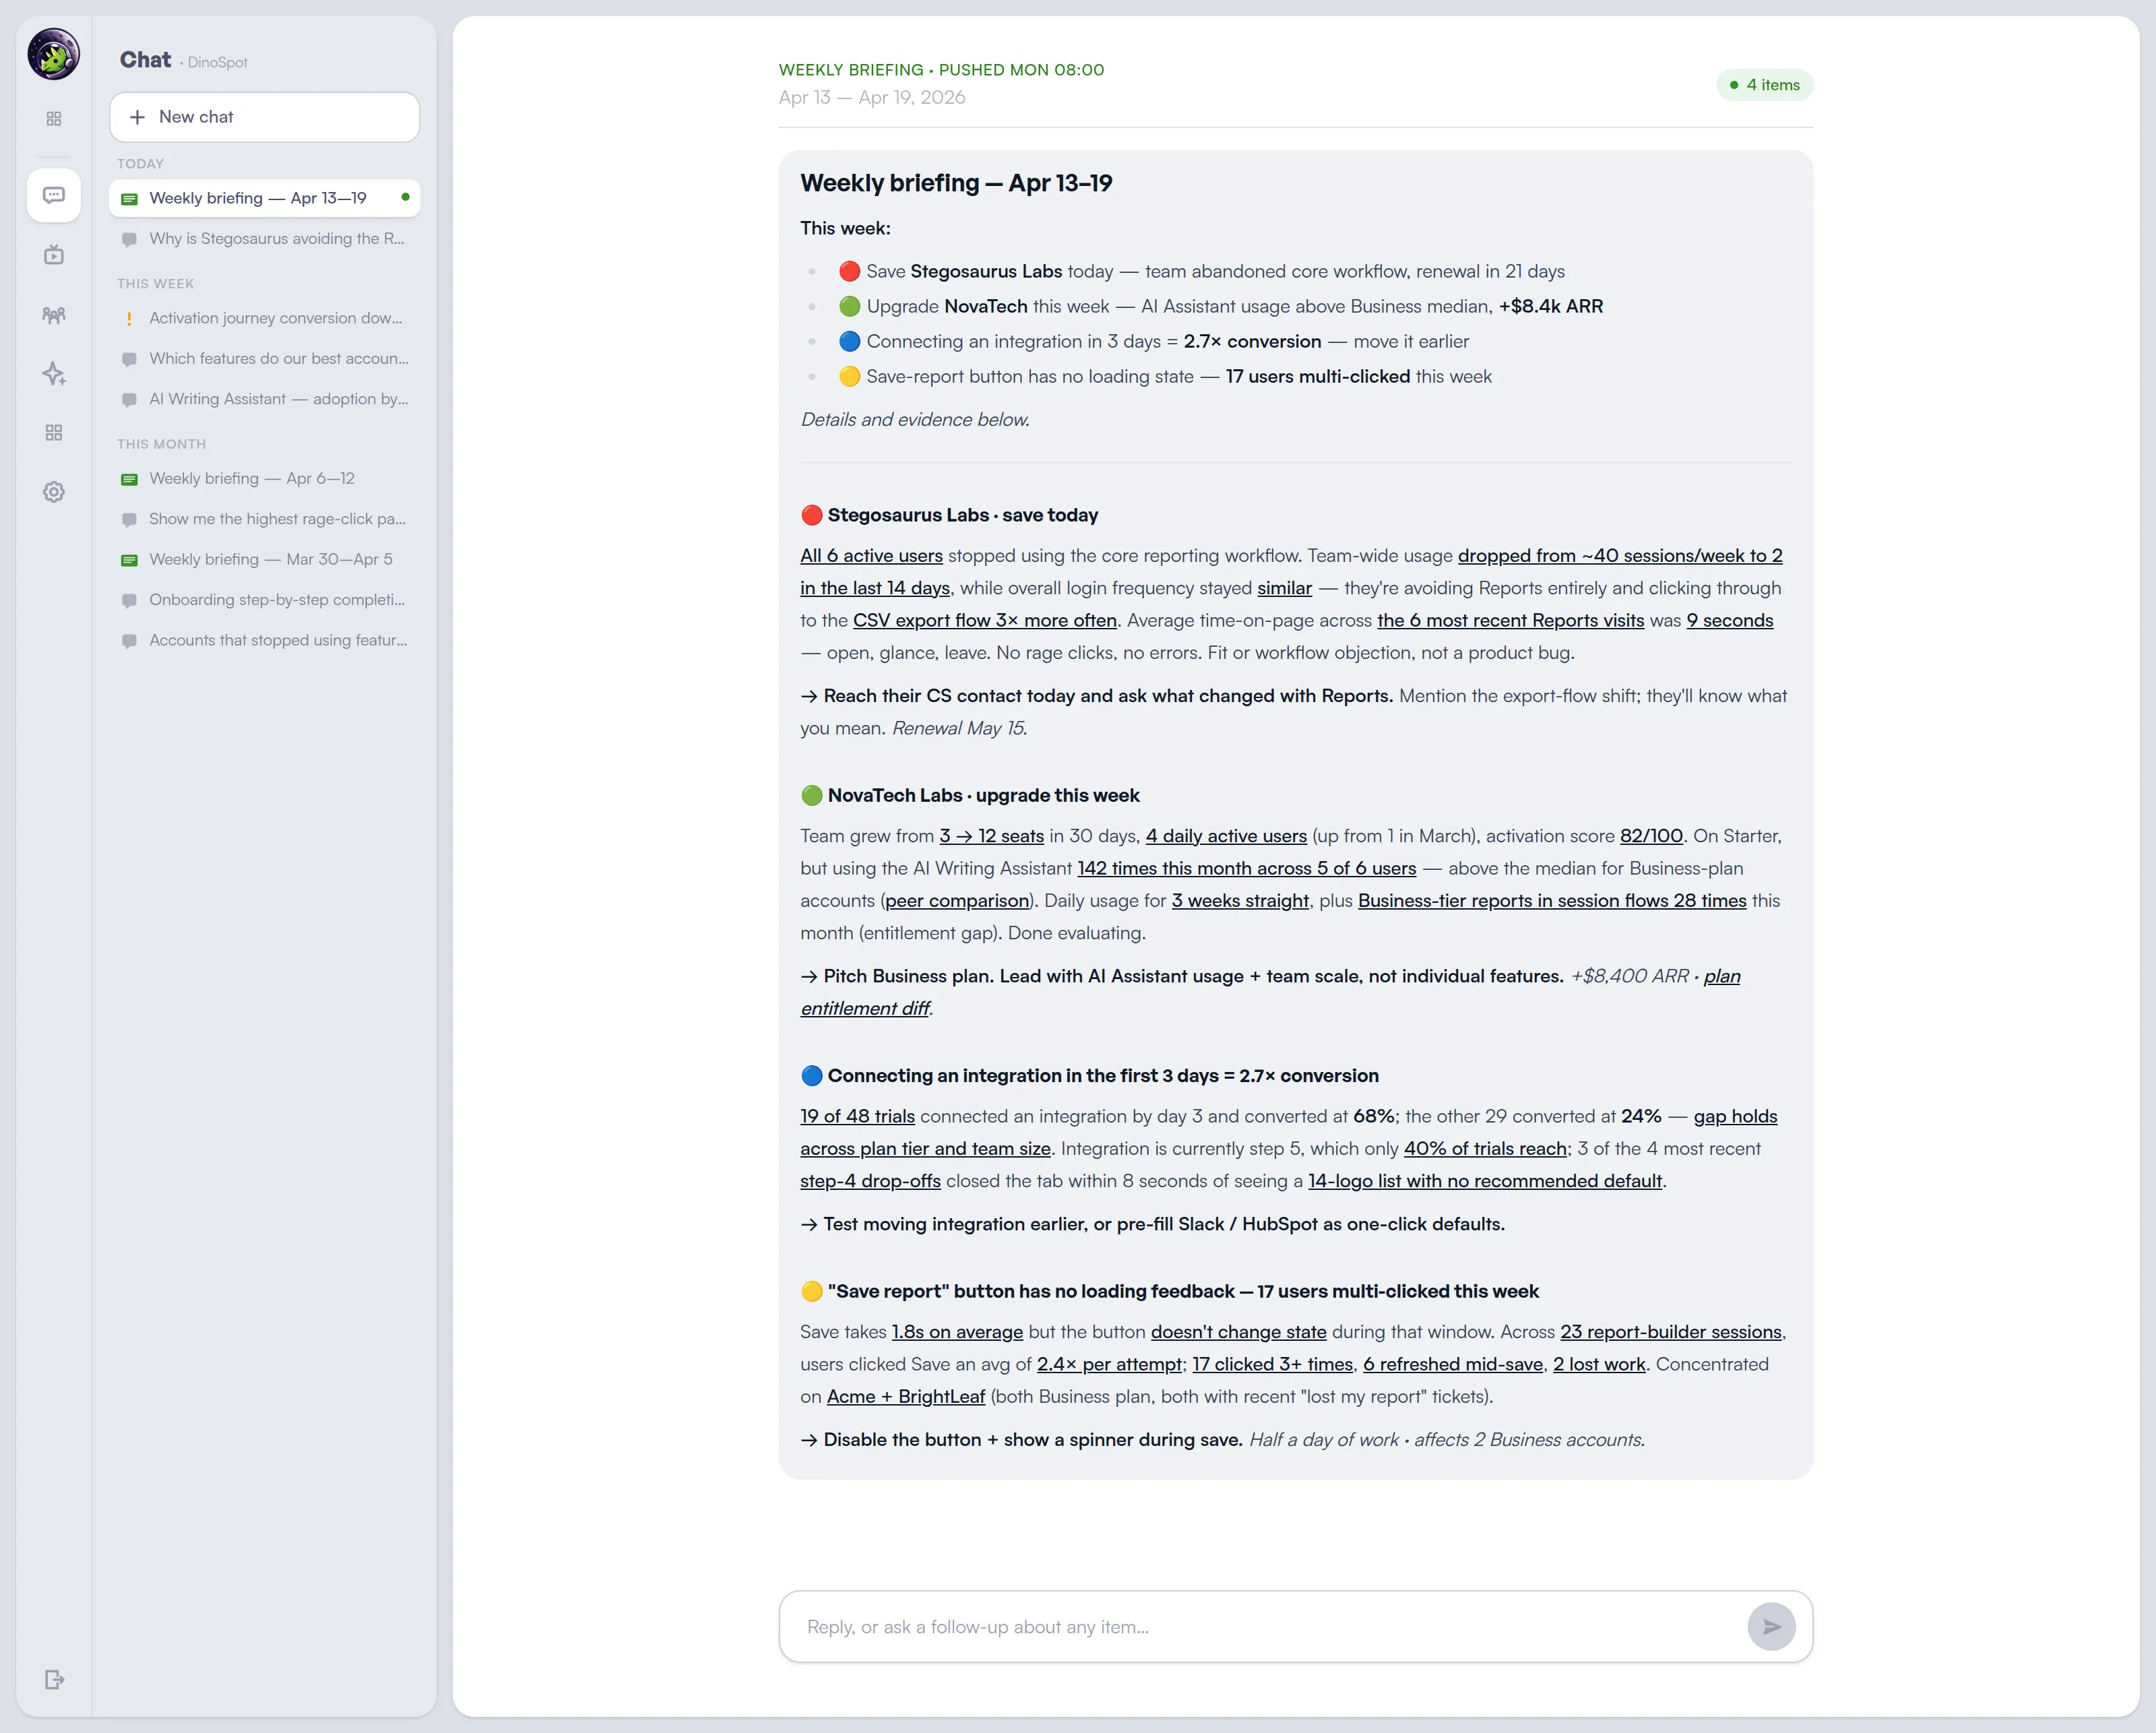
Behavioral churn prediction, without the data team
Behavioral churn prediction is a recurring analyst job: per-account trend analysis across the whole book, every week. Lunar Dinos automates it.
Per-account health, from real usage
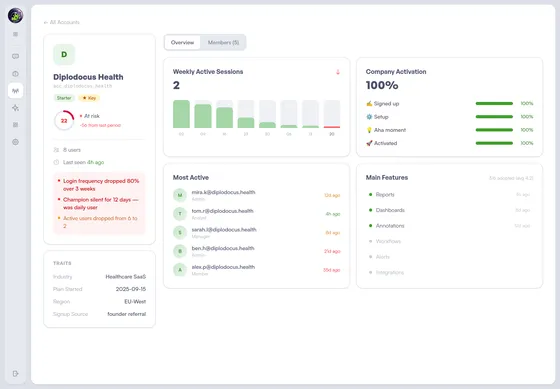
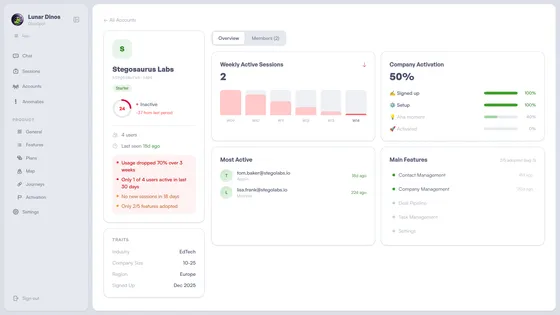
Every account gets a health score from product behavior (activity trend, feature adoption breadth, activation progress, session patterns), compared to peers on the same plan. No spreadsheet, no manual NPS pulls, no quarterly fire drill. The score updates every time the account does something, and the briefing tells you when it changes meaningfully.
Ranked, not noisy
A threshold alert tells you a metric crossed a line. Lunar Dinos tells you the five accounts that matter this week (admin gone dark, core workflow abandoned, team contracting) and which to call first. The list is short on purpose. CS time goes to the accounts where outreach still changes the outcome.
Threshold alerts and chat tools fall short
The alternatives are real. They're also where churn keeps slipping through.
Threshold alerts
Pings when one metric crosses one line for the whole product. No account names, no signal combination, no next step. By the time someone investigates, the account has already disengaged.
Analytics chat ("ask anything")
Useful, if you remember to ask, every week, about every account. Reactive by design. The accounts you don't think to ask about are exactly the ones quietly slipping toward cancellation.
Manual health scores
A spreadsheet of NPS plus gut feel. Lags behavior change by a quarter. Works until it doesn't, usually exposed by the cancellation that came in marked "green" two weeks earlier.
Lunar Dinos
Proactive. Synthesises the four behavioural signals per account, every week, ranked. Names the account, explains what changed, suggests the call. Delivered Monday, no analyst required.
Frequently asked questions
How do you predict customer churn in B2B SaaS?
Behavioral churn prediction watches usage patterns that precede cancellation: login frequency drops, abandonment of core features, shrinking session lengths, and silence from the original champion. In B2B SaaS these signals typically appear 2–6 weeks before cancellation. Lunar Dinos detects them automatically per account and ranks the accounts that need outreach this week.
What is a customer health score?
A customer health score is a single number that summarises an account's likelihood to renew, expand, or churn. Useful health scores combine real product usage (activity trends, feature adoption breadth, activation progress, session patterns) and compare each account to peers on the same plan. Lunar Dinos calculates this automatically from product events, with no manual spreadsheet maintenance.
What signals predict B2B SaaS churn earliest?
Four patterns repeat across B2B SaaS: login frequency drops, with daily users going weekly and weekly going monthly; core-workflow abandonment, where the feature the account onboarded around stops getting used; admin or champion silence, where the person who bought goes dark; team contraction, with fewer seats active week-over-week. Each signal alone is weak; the combination is strong.
Do I need a data analyst to predict churn?
No. Behavioral churn signals are observable in any product event stream. The reason most teams don't catch them is that calculating per-account trends across hundreds of accounts every week is a recurring analyst job, not a one-time SQL query. Lunar Dinos automates that job. The analysis runs every Monday, named per account, with the next step.
How do you build a churn prediction model without a data analyst?
You don't need an ML model in the academic sense. Most B2B SaaS churn is predicted by four observable patterns measured against each account's own historical baseline: login frequency drop, core workflow abandonment, champion silence, and team contraction. The hard part isn't the math; it's running that comparison weekly across hundreds of accounts and turning the result into a ranked list of who to call. Lunar Dinos automates the whole pipeline (detection, ranking, account-naming, next-step suggestion) so the artifact lands in your inbox every Monday.
Can churn be predicted from product usage data alone?
In B2B SaaS, yes. Behavioral churn signals (login rhythm, feature use, champion activity, team size) are the strongest leading indicators 2 to 8 weeks before cancellation. NPS, support tickets, and satisfaction surveys are lagging indicators by comparison: they confirm what product behavior already showed weeks earlier. Combining product usage with health-score peer comparison is enough for accurate per-account churn risk in most B2B SaaS contexts.
Catch churn before the renewal call
The accounts slipping this week: named, ranked, with the reason and the next call. Delivered every Monday.