Find what drives trial-to-paid conversion,
without a data team.
Activation analysis for B2B SaaS, without a data analyst. Lunar Dinos finds the week-one behaviors that separate trials that convert from trials that don't (integration depth, team breadth, core-action repetition) and tells you which trials are accelerating, which are stalling, and what's about to lock them in.
Why activation keeps slipping past you
Every PLG playbook says find your activation moment, then build customer onboarding around it. Almost nobody does. The work (cohort analysis across the whole signup base, kept current as the product changes) is a recurring analyst job, and most B2B SaaS teams don't have an analyst.
Activation by gut feel
You know activation matters. You don't know what yours is. The team agrees it's "probably the moment they connect an integration", based on three sales calls and a hunch. Onboarding gets built around that hunch.
Funnels nobody updates
The signup-to-paid funnel was built nine months ago around three events from the old onboarding. Two of those events don't fire anymore. Nobody noticed because the dashboard still loads. So the headline conversion number is wrong.
The aha moment, unnamed
Slack's was famously 2,000 messages. Dropbox's was the first upload. Figma's was the first shared file. Yours exists in your data right now. It hasn't been named because nobody has had four uninterrupted weeks to look for it.
The behaviors that actually predict conversion
Four kinds of week-one behavior repeat across B2B SaaS activation. Each is observable in product data. Together, they are the framework for finding the activation moment in your product.
1 · Integration depth
How quickly accounts connect their existing tools (CRM, identity provider, data sources). It predicts commitment because it's friction the user chose to take on. Earliest visible signal in B2B trials.
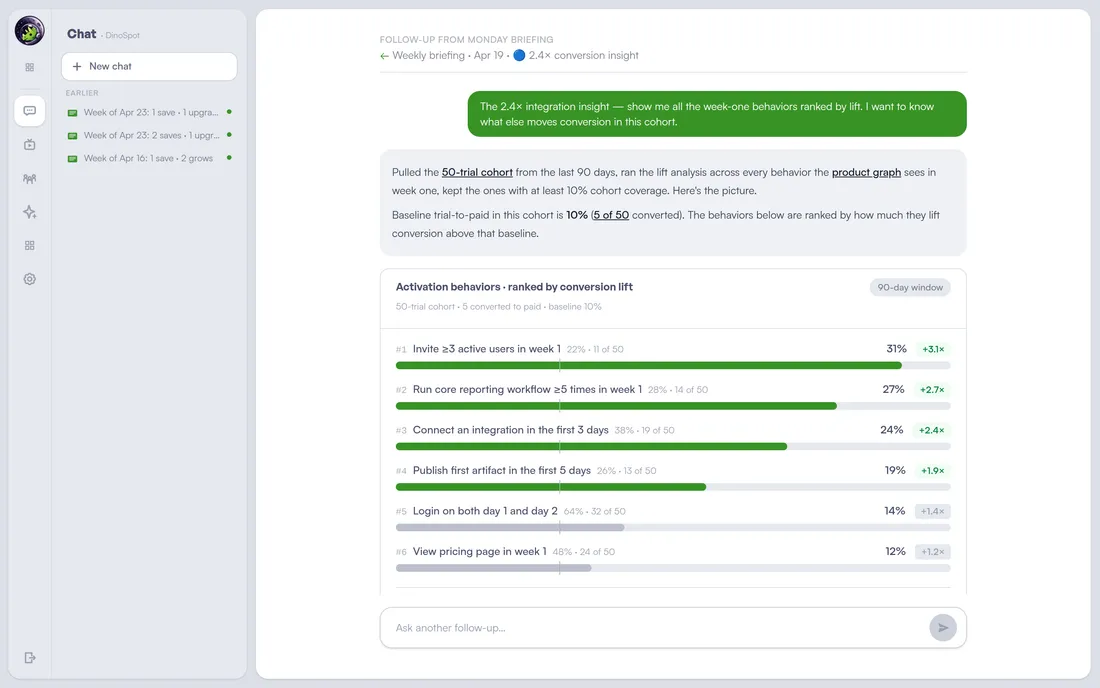
"Plesiosaur Logistics connected Salesforce on day 2, completed activation by day 5. Across the cohort: integration in the first 3 days lifts conversion 2.4x."
2 · Team breadth
How many real users from the same account log in during the trial. One person testing alone is a vulnerable trial. Three people using it daily is a renewal in waiting, and the harder switch to undo.
"Crustacean Corp: 6 users invited in week one, 4 stayed active. Trials with ≥3 active users in week one convert at 3.1x."
3 · Core-action repetition
How many times the account does the thing your product is for. Slack's was famously 2,000 messages. Dropbox's was the first file. Figma's was the first shared frame. Every B2B SaaS product has its own magic number.
"Reptile Systems ran the reporting workflow 14 times in week one. The threshold for your product lives in this kind of pattern: repetition past a tipping point."
4 · Time-to-first-output
How fast accounts produce the first artifact with value outside the product (a published report, a closed deal, a shipped document). Output is the leading indicator of "we can't go back to doing this without the tool."
"Pterodactyl Labs published its first report on day 4. Accounts producing a shareable artifact in the first 5 days convert at 1.9x."
Each pattern alone is a hypothesis. Run across the whole signup base and ranked by lift, the combination tells you which behaviors actually drive your conversion, not which behaviors the team thought would.
The Monday activation brief
Trials accelerating toward conversion. Trials stalling on the activation behaviors. The onboarding step where this week's drop-off concentrated. The whole top-of-funnel motion in one Monday artifact.
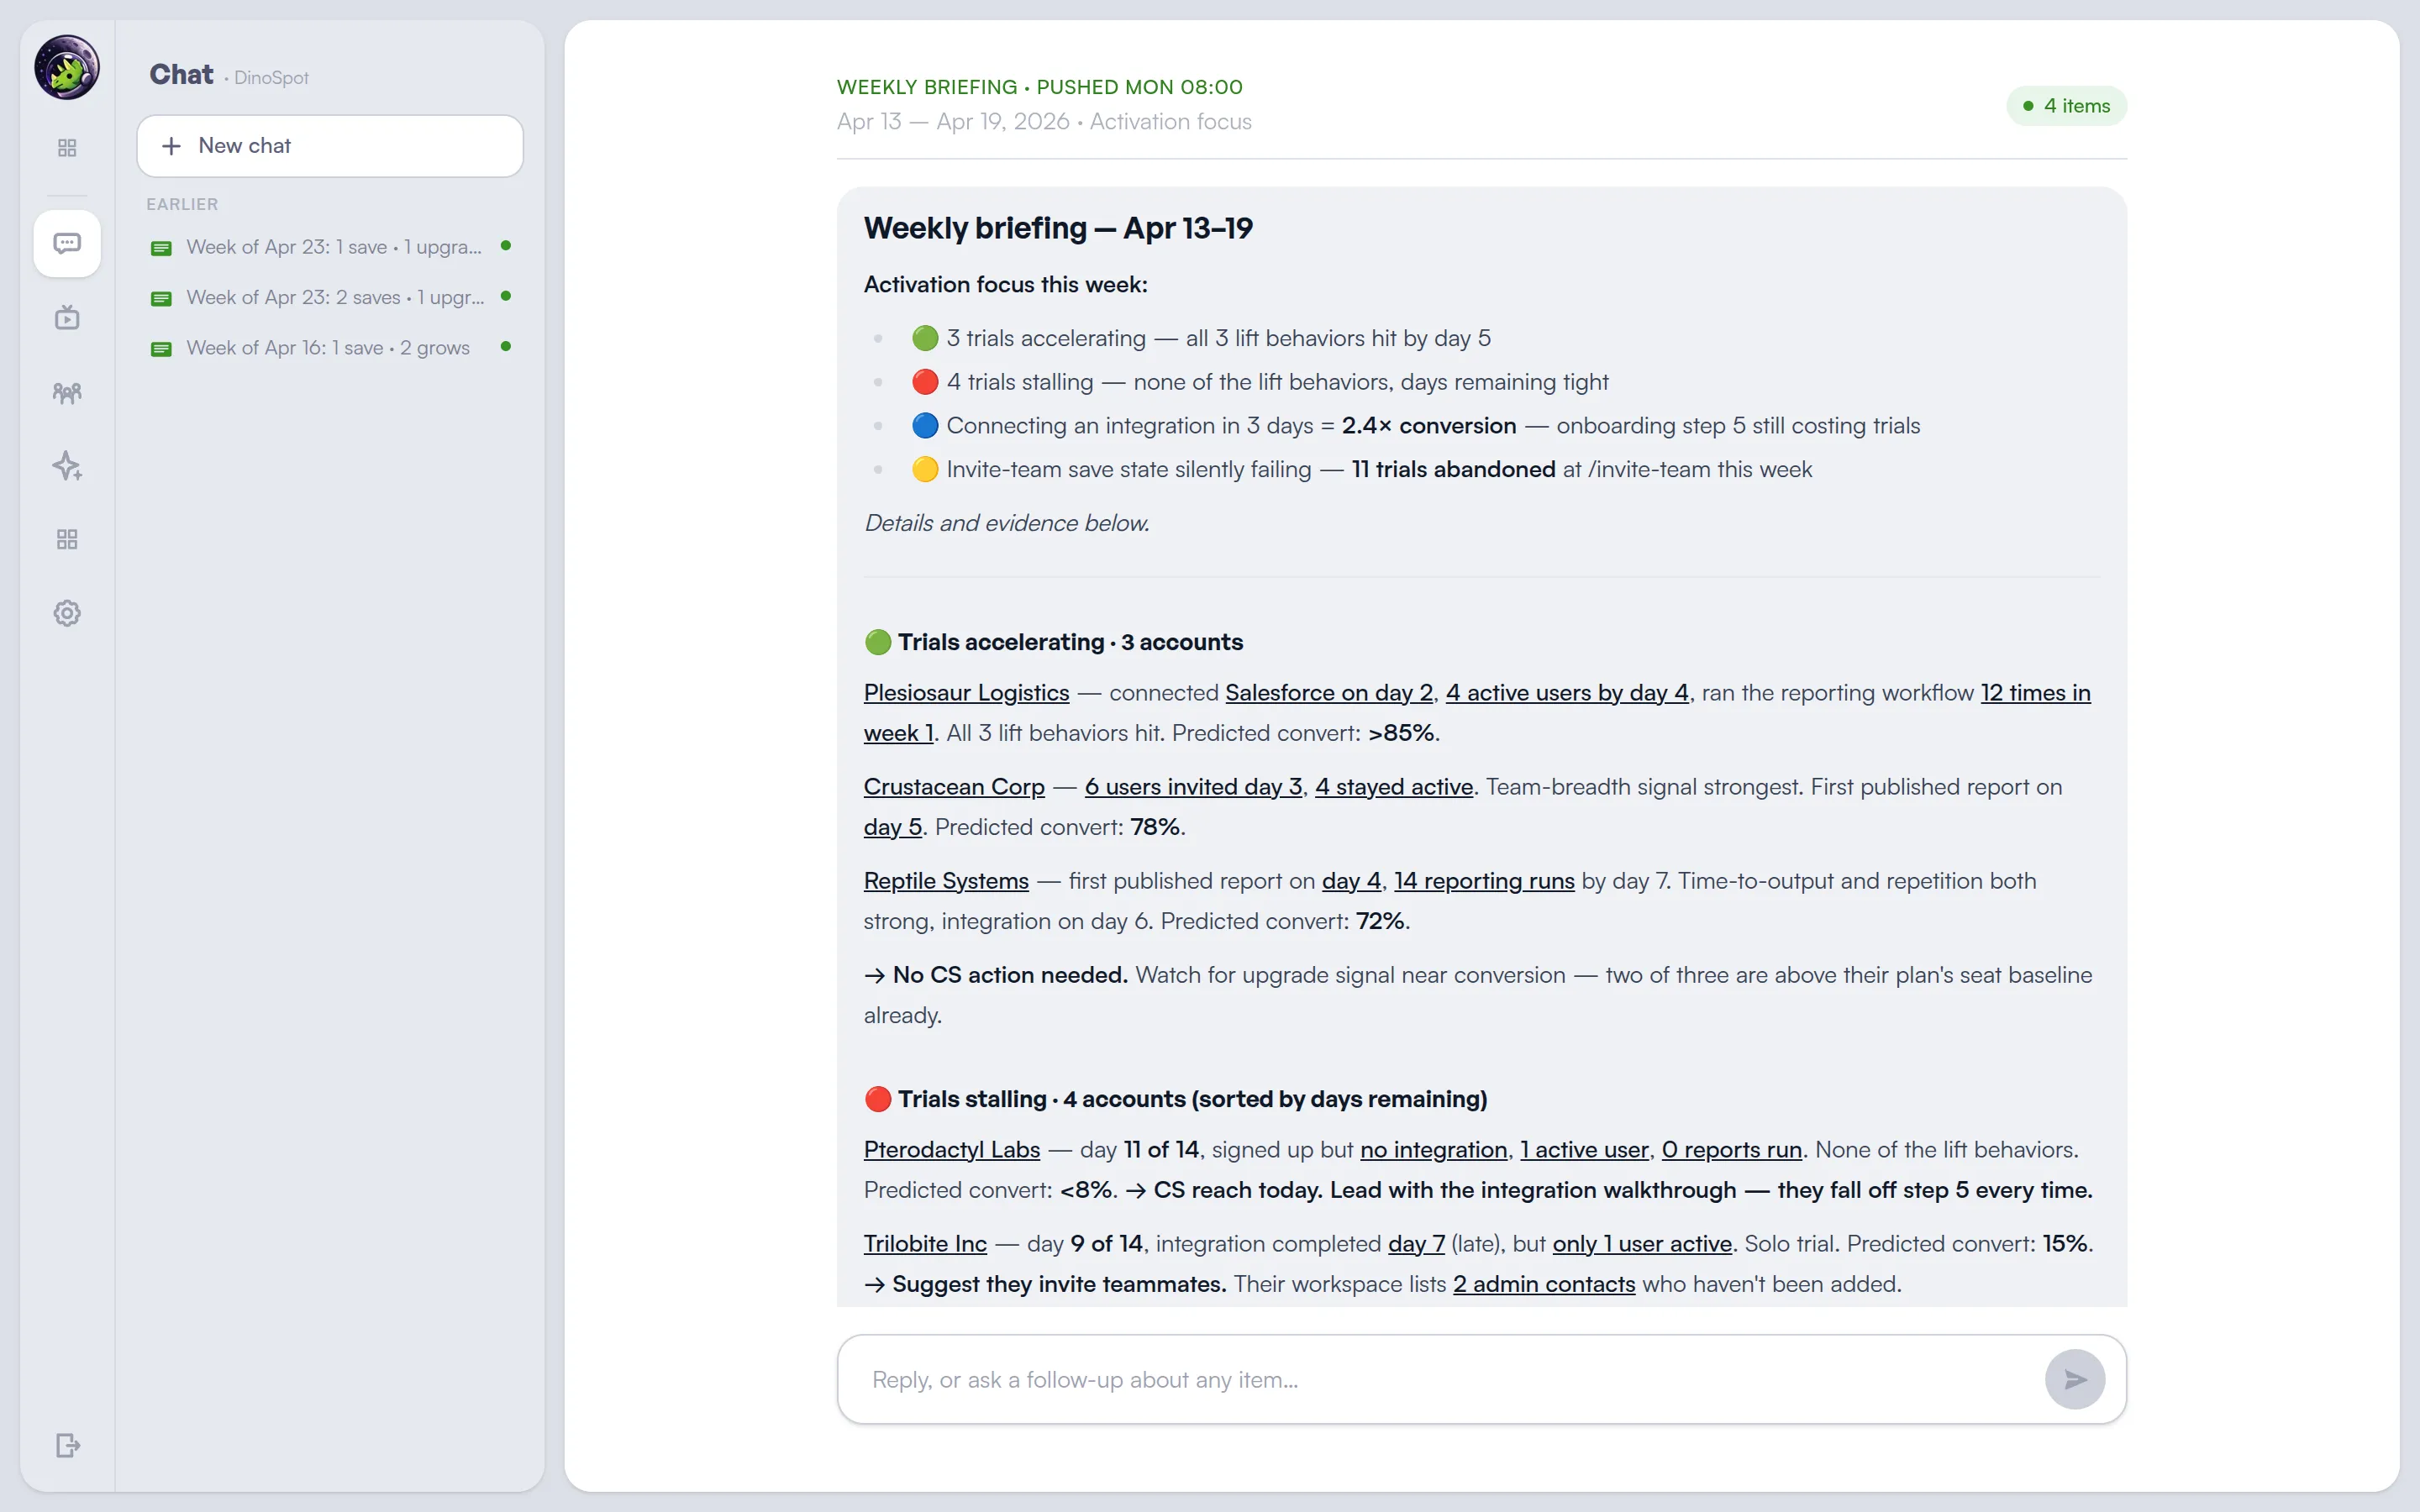
Activation analysis, without the data team
Activation analysis is a recurring analyst job: cohort comparisons across the whole trial base, sliced by persona and plan, refreshed as the product evolves. Lunar Dinos automates it.
The activation behaviors, ranked by lift
The behaviors that separate converters from non-converters, ranked by how much they lift conversion. No event taxonomy to define, no funnel to configure. The analysis runs across raw session data and updates as the product ships. The behaviors that matter today are the ones at the top of the list, with the cohort sizes and lift numbers to back them up.
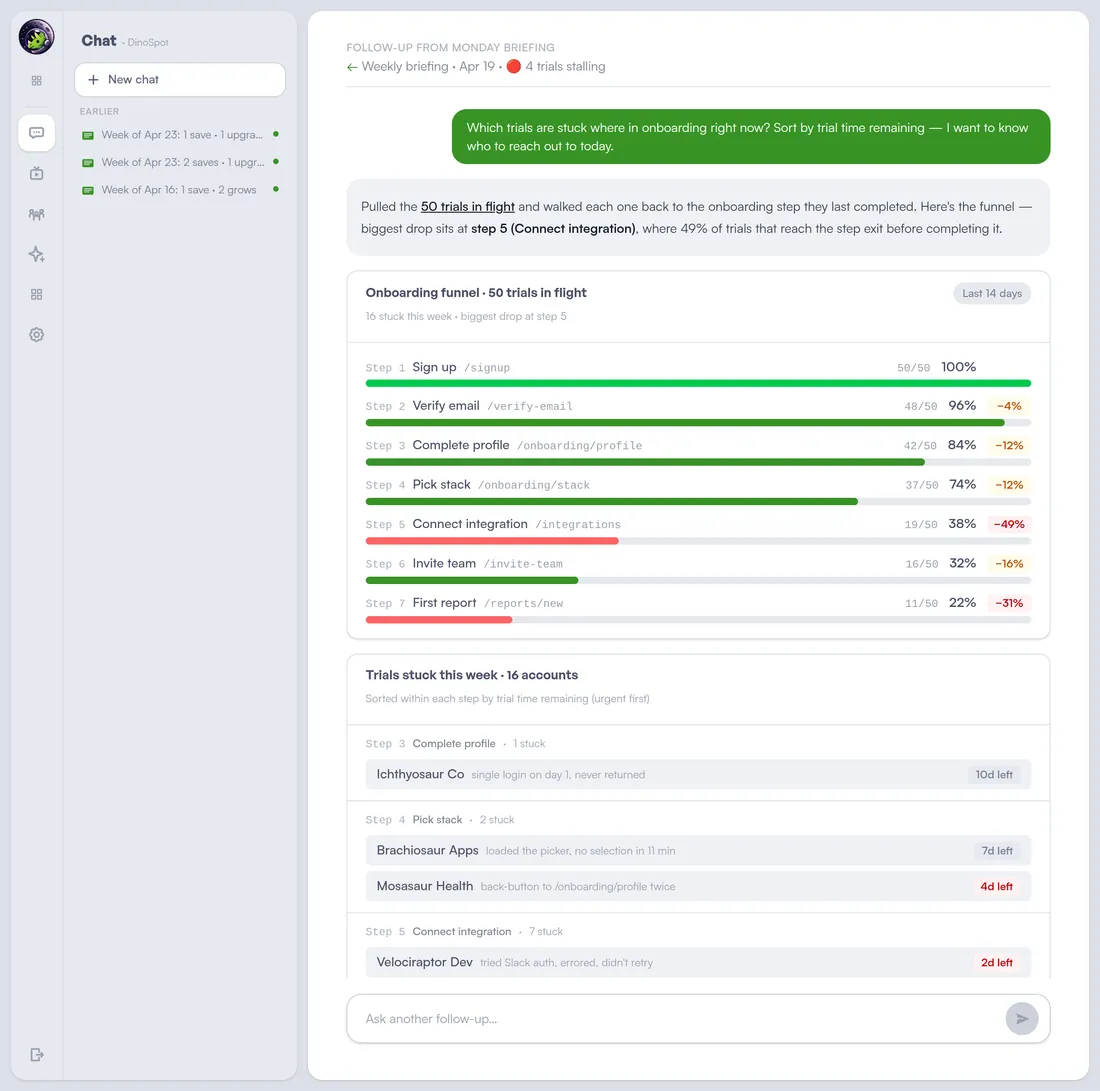
Where trials drop off, named per account
A funnel chart tells you 38% drop off at step three. It doesn't tell you which 38%. Lunar Dinos names the accounts stuck at each step, with the activation behavior they haven't hit yet and how long they have left in the trial. CS and product see the same list. The team that fixes the step has the accounts to call while they fix it.
Funnels and chat tools fall short
The alternatives are real. They're also where activation analysis quietly stops happening.
Manual cohort analysis
A SQL query, a slide deck, a quarterly review. Useful once. Stale by week six because the product shipped. The activation moment named last quarter is no longer the activation moment, and nobody on the team has time to redo the analysis.
Funnel dashboards
Tell you the conversion rate at each step. Don't tell you which behavior in week one separates the converters from the non-converters. The funnel is a measurement; activation is a discovery. Different jobs, different tools.
Analytics chat ("ask anything")
Useful, if you remember to ask, every week, with the right question. Activation discovery isn't a question you ask once. It's a hypothesis space you have to traverse systematically. Pull-based tools quietly miss the patterns nobody thought to query.
Lunar Dinos
Proactive. Discovers the week-one behaviors that lift conversion, ranked by lift and refreshed as the product changes. Names the trials accelerating, the trials stalling, the onboarding step concentrating drop-off. Delivered Monday, no analyst required.
Frequently asked questions
What is product activation?
Activation is the moment an account experiences the core value of your product for the first time. It's the behavior that, once done, correlates strongly with long-term retention. Slack's was famously 2,000 messages sent in a team. Dropbox's was the first file uploaded. Figma's was the first shared file. Every B2B SaaS product has one. Most teams haven't found theirs, because finding it requires cohort analysis across the whole signup base, repeated as the product evolves.
How do you find your activation moment?
Compare what retained accounts did in their first weeks against accounts that churned. The behavior that separates them, strongly and repeatably, is your activation moment. The math is simple correlation analysis; the work is running it across hundreds of cohorts and slicing by plan, persona, and onboarding path, then keeping it current as the product changes. Lunar Dinos automates this and surfaces the highest-lift behaviors as named patterns ("connect an integration in the first 3 days").
What is trial-to-paid conversion?
Trial-to-paid (or free-to-paid) conversion is the share of trials or free accounts that become paying customers. The B2B SaaS median is 15–25%. The lever isn't usually trial length or pricing. It's whether the account experienced enough value during the trial to feel the loss of cancelling. That value moment is activation. Improving activation rate is the highest-leverage way to improve trial-to-paid conversion.
Do I need a data analyst to find activation?
Historically yes. Finding an activation moment was a multi-week cohort analysis project, repeated as the product changed. The signal itself is simple (which behavior in week one separates converters from non-converters), but running it across many cohorts, slicing by persona and plan, and keeping it current is exactly the recurring analyst work most B2B SaaS teams at 20–150 people don't have someone for. Lunar Dinos automates the analysis and re-runs it weekly.
How long does activation take in B2B SaaS?
In B2B, activation usually happens in the first 3–14 days, not minutes. Multiple users on the account need to log in, the admin needs to finish some setup, and someone has to do real work in the product. Optimising for "activation in 5 minutes" is a consumer-app frame. The B2B question is: which behaviors in the first two weeks predict month-two retention?
Can you measure activation without defining events?
Yes. Lunar Dinos discovers behavioral patterns from raw session data, with no event taxonomy and no funnel configuration. The product graph maps how accounts use your software and surfaces which behaviors correlate with retention. You don't need to guess what to measure; the analysis tells you which behaviors matter and which don't.
Find the activation moment in your data
The trials accelerating, the trials stalling, the onboarding step where drop-off concentrates this week. Named per account, ranked by lift, delivered every Monday.